Released last year, NVIDIA FrameView v1 entered the world to serve as a way to measure graphics and games performance. In a world dominated by an outdated Fraps and Afterburner, there’s a big space to fill for modern performance testing. In our quest to find the perfect tool, we’ve covered a lot of these tools before but over the year, none have really taken off. Presentmon-based tools seem to be the direction a lot of the new performance benchmarking tools are going with. In a modern, visual-driven world where people just run off to Youtube for performance numbers, tools like CapFrameX, Fraps and FrameView and such, the ability of users to personally see the performance of their own machine without relying on other people’s hardware or requesting specific configurations from reviewers, etc limit their ability to understand and tweak, configure and upgrade their system for their own personal needs and liking, reducing the need to do experimentation and purchasing unnecessary or even worse, less optimal hardware.
Going back to FrameView, today we have the release of the v1.1 of FrameView from NVIDIA. This tool serves to provide further integration to tools that will be released in the coming days but for now we’ll focus on FrameView. Version 1.1 brings with a couple of notable updates over the original release and although I was personally fond of the original but I’ve decided to favor CapFrameX over FrameView 1.0 for quality-of-life reasons. FrameView v1.1 brings with a couple of significant features that, together with some upcoming tools, is aimed to provide reviewers a more detailed peek into graphics and gaming peformance. On the other hand though, for end-users, they will still receive a fully-featured benchmarking software that allows capturing of raw gaming throughput by means of framerate as well as frame pacing, and efficiency presented thru performance-per-watt figures. This gives gamers a really hands-on tool to let them test their own hardware with literally zero knowledge of the intricacies of benchmarking. As long as they can work a game, click a few in FrameView and lastly load up an Excel file, you’re good. So let’s see what’s new in FrameView v1.1.
What’s New in FrameView 1.1
- Vulkan Overlay
- Rendering Present Latency
- CPU Clocks, Utilization, Temperature, and Power
- GPU Clocks, Utilization, and Temperature
- Full support for PCAT (Power Capture Analysis Tool)
- Power numbers from PCAT are logged in FrameView Log files with corresponding changes in FV overlay
- System parameters like CPU name, GPU name, API, Resolution (only for full-screen mode), OS, System RAM, Motherboard, GPU Base Driver, and GPU driver Package in log files
- Per-app log files for multiple runs
- Installer Support and UI improvements
- Expanded Excel Template for Charting
NVIDIA describes FrameView as a performance metric capture software aimed to deliver percentile FPS data as well as average FPS data. This shows actual gaming performance but since FrameView has a lot of information it can show, it has the potential to showcase much more than just pure gaming performance. Now the significance of this is that if you’re particular about a certain information, all you need is some data manipulation knowledge by way of utilizing CSVs thru spreadsheet programs.
FrameView v1.1 Interface
FrameView v1.1’s new interface removes a lot of options from the original and leaves only two check boxes for including dropped frames and perf-per-watt in the overlay. Other than that, the rest of the options are the same such as directory location for saving log files. We also still have the option of choosing which is the capture key which gives us the options for using Scroll Lock or F10 as the capture hot key. This is followed by the capture delay and capture duration for limiting the captured timeframe of the benchmark as well as delaying the start of the benchmark. Last up we have the overlay location.
Installation
FrameView v1.1 is now publicly available via NVIDIA’s website. Download here.
Usage
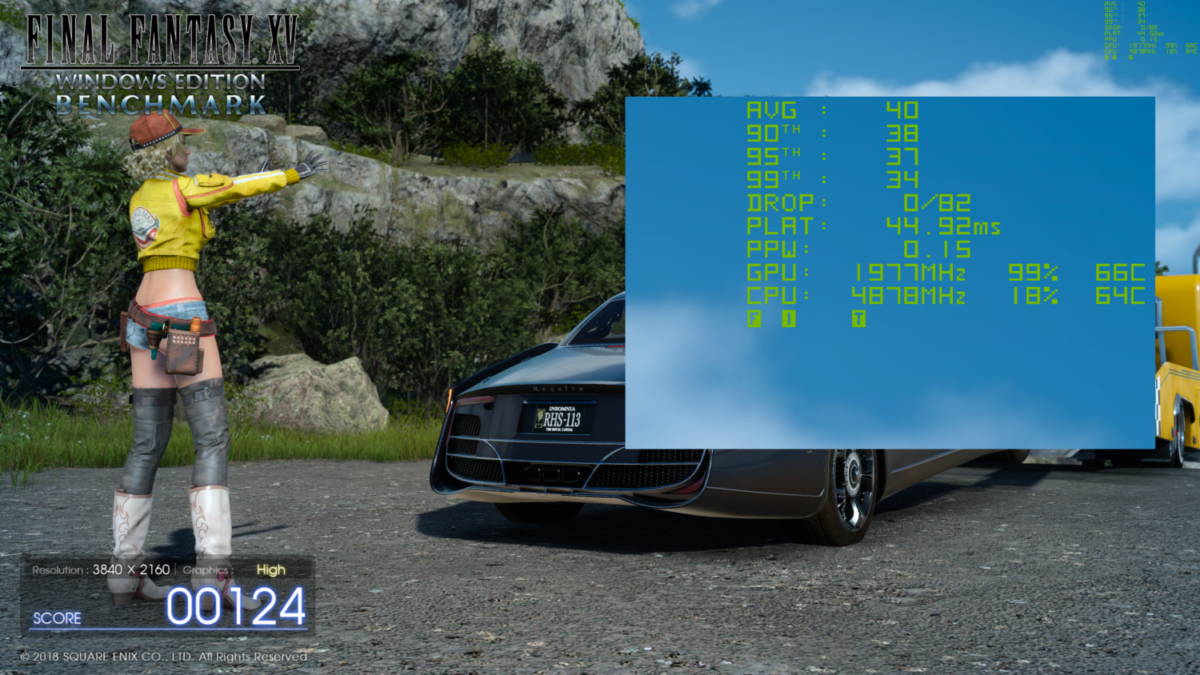
Much like Fraps, once running, it puts an overlay to any game or any 3D application running on-screen. FrameView v1.1 update adds overlay support for Vulkan but DirectX9 and DirectX10 application do not have an overlay. You can still get a log file if you are benchmarking. For those that need the overlay, Afterburner and CapFrameX provides overlay for DX9 applications.
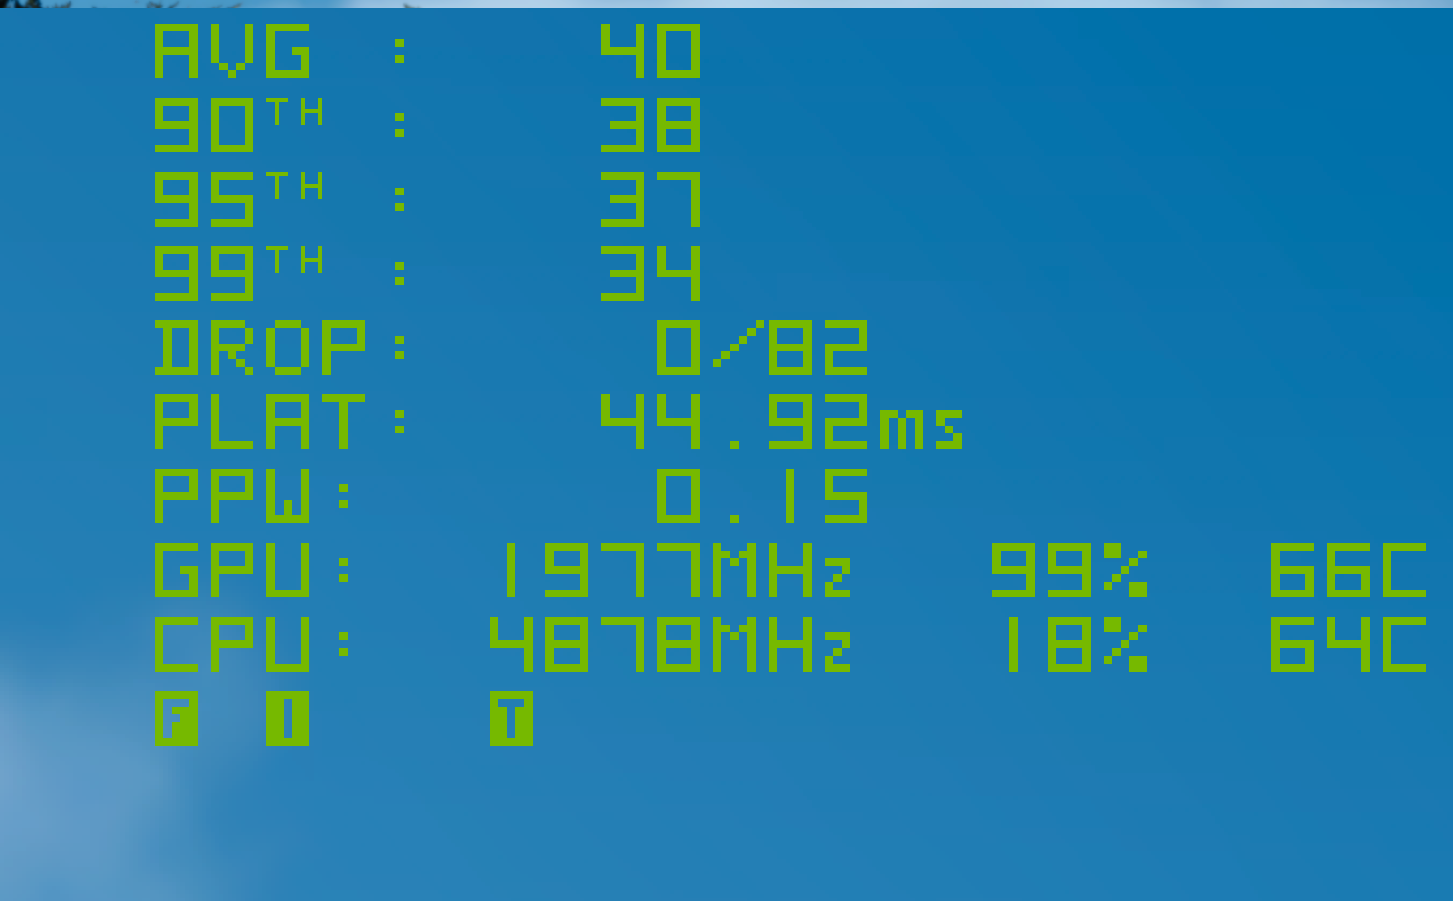
The overlay shows us the average frame rate as well as percentiles. Think of percentiles as a point in which the percentile indicate is the number that indicates that 99% of the previously rendered frames have achieved at least that number e.g. for the example overlay above, 99% of the frames has achieved 34 frames. The same goes for the 95th and 90th percentile. Most people will easily go to average FPS as the primary number and that’s good but percentiles give us a good point of gauge how stable that frame rate is.
Moving along the overlay we have dropped frames dubbed DROP which shows dropped frames are present when we get a 1. After that is PLAT which is Present Latency.
A nice inclusion is PPW or performance-per-watt. Since this is an NVIDIA tool, if an NVIDIA card is being used, we can see just how efficiently our card is working. Higher values are desirable for this. Take note that AMD cards do not have this information in the overlay but they have data in the log.
Last up we have the CPU and GPU information, how much of each resource we are using and also the temperature readings for both. At the end are letter icons that indicate fullscreen, iflip or independent flip which means the application is simulating Fullscreen Exlusive and T which indicates tearing. This is running scenario. Other indicators are for Vsync and Windowed mode indicated by a W and V.
FrameView Capture Log
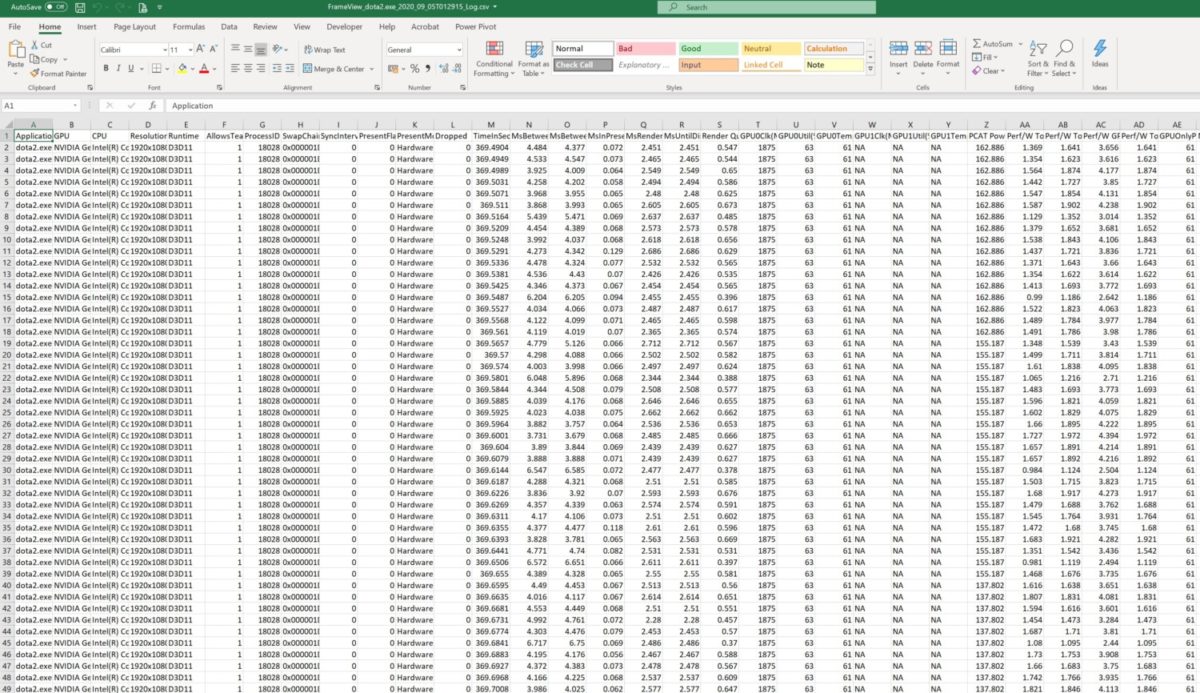
In the selected directory in the app, FrameView will store 2 types of file: a per application log file and a summary file. The summary file lists a summarized list of all the tests done in that directory summarized into single line entries, perfect for at-a-glance reference. The meat of the data comes from the capture log files. These log files are vast and have a rich assortment of information contained within them.
Due to the vast majority of headers in this file, the screenshot above is cutoff so I’ll just post a list below from the included ReadMe file in the install directory:
- Application The name of the process that called Present (if known)
- GPU
- CPU
- Resolution
- Runtime
- AllowsTearing Whether tearing is possible (1) or not (0)
- ProcessID The process ID of the process that called Present
- SwapChainAddress The address of the swap chain that was presented into
- Runtime The runtime used to present (e.g., D3D9 or DXGI)
- SyncInterval Sync interval used in the Present call
- PresentFlags Flags used in the Present call
- PresentMode The time of the Present call, measured from when FrameView/PresentMon recording started in seconds
- Dropped Whether the frame was dropped (1) or displayed (0); if dropped, MsUntilDisplayed will be 0
- TimeInSeconds The time of the Present call, measured from when FrameView/PresentMon recording started in seconds
- MsBetweenPresents The time between this Present call and the previous one, in milliseconds
- MsBetweenDisplayChange The time between when the previous frame was displayed and this frame was, in milliseconds
- MsInPresentAPI The time spent inside the Present call, in milliseconds
- MsRenderPresentLatency The time between the Present call (TimeInSeconds) and when the GPU work completed, in milliseconds
- MsUntilDisplayed The time between the Present call (TimeInSeconds) and when the frame was displayed, in milliseconds
- Render Queue Depth
- GPU0Clk(MHz)
- GPU0Util(%)
- GPU0Temp(C)
- GPU1Clk(MHz)
- GPU1Util(%)
- GPU1Temp(C)
- PCAT Power Total(W)
- Perf/W Total(F/J) (PCAT) Performance per Watt considering MsBetweenPresents for performance and board power reported by PCAT
- Perf/W Total(F/J) (API) Performance per Watt considering MsBetweenPresents for performance and board power reported by API
- Perf/W GPUOnly(F/J) (API) Performance per Watt considering MsBetweenPresents for performance and GPU/Chip/ASIC power reported by API
- Perf/W Total-USBC(F/J) (API) Performance per Watt considering MsBetweenPresents for performance and board power excluding USBC reported by API
- GPUOnlyPwr(W) (API) GPU/Chip/ASIC power
- NV-Total-USBCPwr(W) (API) Board power excluding USBC
- NV Pwr(W) (API) Board power
- AMDPwr(W) (API)
- CPUClk(MHz)
- CPUUtil(%)
- CPU Package Temp(C)
- CPU Package Power(W)
- CPU TDP (W)
- CPUCoreUtil%
Now at this point, if you know how to do averages in your spreadsheet program like Excel, you can get a quick average from the data you just gathered. For advanced users, you can also make your own data analysis based on the capture logs but for those that want a simple charting and visualization tool, NVIDIA has finally included the FrameView Analyzer template with v1.1.
FrameView Analyzer Template
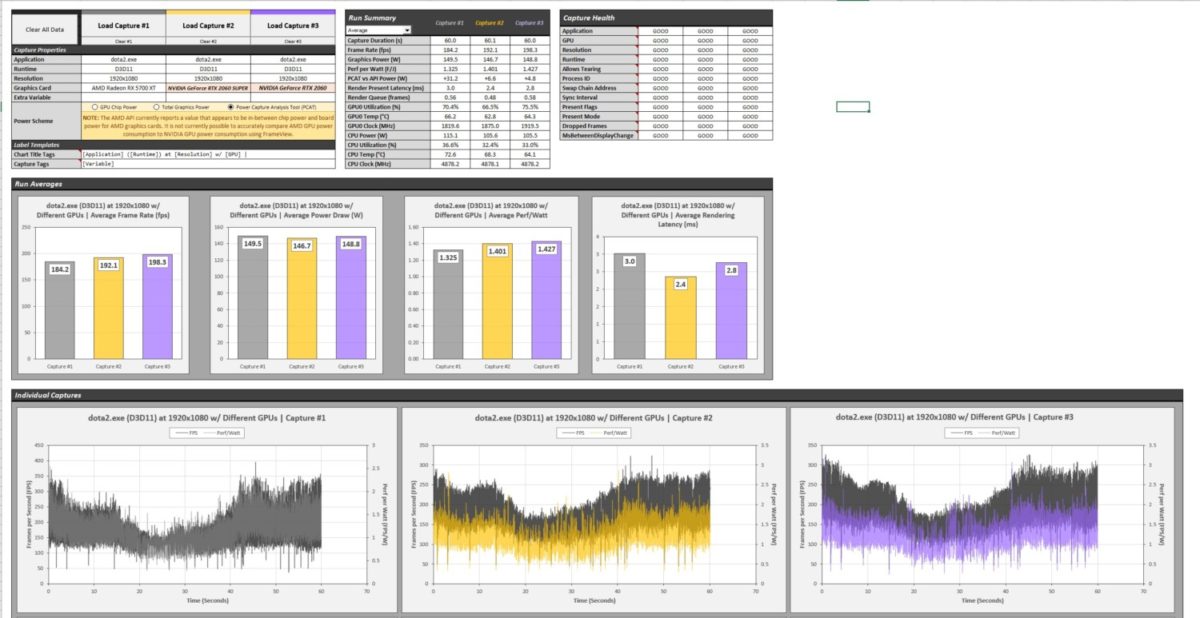
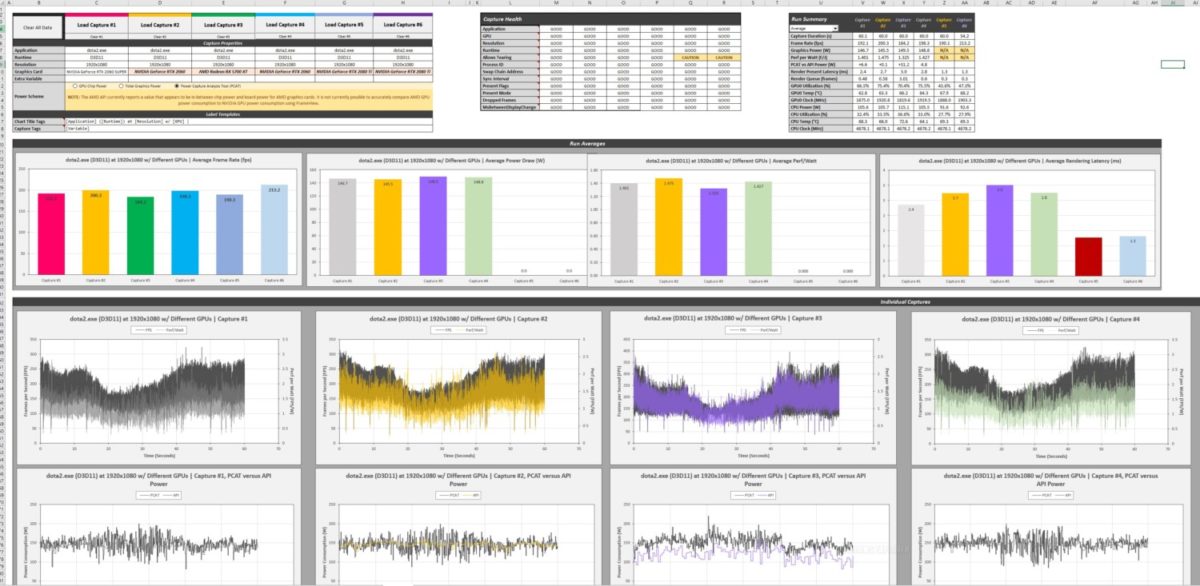
Included in the FrameView v1.1 installation is an Excel spreadsheet called Frameview Analyzer Template. This is a macro-enabled Excel spreadsheet which utilizes some advanced Excel to create its dynamic user interface. This file used to be limited for members of the press but as of v1.1, the new and more advanced version is now available to the public. This new version has some cool features but for the most retains much of the what was originally available. We do get some features like support for PCAT, an upcoming tool from NVIDIA which is related to power as well as a new capture health table that shows a quick list of things that may be of concern. A run summary is also added for a quick reference of the information of the run like capture duration, and others.
The Excel uses advanced Excel formulas but can still be customized to your liking. Some of the info for the titles can easily be changed but for very advanced users, they can go ahead and customize the charts and extend the template itself for added usability.
Here’s an example of a customized template, extended for my need of a 6-sample, personalized charting template:
Now, I do have a personalized Excel template for manipulating the logs but that is still a work-in-progress but that just shows that if you know what you’re doing, there is an infinite way of manipulating and visualizing the data for presentation, either for reference like my modification of the original analyzer file or a ground-up solution for your needs. Still, for those that don’t really care, the default NVIDIA FrameView Analyzer template provides a rich display of information particularly efficiency but frame pacing and other things can be seen in the chart as well.
Conclusion
This article aims to be an introduction rather than full blown exploration of FrameView. As you know, it has been a very busy time for the PC industry with launch back-to-back in recent weeks and I’ve not had the time to manipulate the information from this tool to my liking. From a performance standpoint, it shows everything but then again its reliant on Excel for the usability of the data for common users and even with the prevalence of Excel, cases exist wherein users may not have or don’t need Excel in their gaming system. This is a concern as the usability of the log information of FrameView only exists if the user understands and can utilize the information.
I believe NVIDIA could build a tool that can showacse as well as easily visualize this information without the need for Excel. CapFrameX is a good example of a complete tool which is easy to use as well as informative which gives users an end-to-end solution for benchmarking their systems. Still, FrameView has its strength and that may become more apparent in the coming days but as it is, I think a fully-featured software utility like GPUReport’s FLAT but with a more modern and optimized way of reporting which would allow users to load, choose which charts they need then export or share the files for use in forums, tech support inquiries and comparing them with other users.
We look forward to how FrameView matures especially with the GeForce RTX 30 series focus on not just sheer system throughput but system latency and efficiency as well.


