We have an updated article covering our game benchmarking here.
Game benchmarks are regarded by gamers and enthusiasts as a guide in choosing a new CPU and a new GPU for a gaming PC. Review sites do benchmarks to analyze how different combinations of CPU and GPU affect gaming performance or to know how a newly released game performs on a variety of hardware. The frame rate is used to measure gaming performance and it is simply the number of frames per second. Higher frame rate usually means better performance. So, it’s just a matter of looking at which has a higher frame rate, right? Yes, but sometimes you would see contrasting benchmark results of a game from different review sites even if they all used almost the same PC components. Obviously, the game settings used greatly affects the results but a lot of popular review sites don’t tell their readers what part of the game they benchmarked. Benchmarking the whole game is ideal but it would be very time-consuming because games like usually take 8 – 12 hours to finish. A section of the game to be benchmarked needs to be chosen and this is the cause of the contrasting benchmark results. Later in the article, we would show you how the benchmark results are influenced by the section of the game that was benchmarked.
Another thing we would like to discuss is frame time benchmarking. It is relatively new and was popularized by Tech Report last September 2011. Frame time benchmarking is measuring the time it takes for each frame to be rendered. It is not a replacement for frame rate benchmarking and you might be surprised to know that the frame rate data comes from the frame time data.
How We Tested
The PC we used for testing is shown below.
Processor: Intel Core i7 4790K 4.0 – 4.4 GHz (Turbo disabled)
Graphics Card: Gigabyte GeForce GTX 970 4GB ITX
Motherboard: Gigabyte Z97-D3H rev 1.0
Memory: 4GBx2 DDR3 2400 MHz
Power Supply: Corsair HX 620
Driver: GeForce 359.06
Operating System: Windows 10 64-bit
We configured Hyper Threading and the number of active CPU cores of Core i7 4790K thru the BIOS to simulate different CPU configurations. Disabling 2 CPU cores of Core i7 simulates Core i3 while disabling Hyper Threading of Core i7 simulates Core i5. This is not a 100% accurate simulation because Core i3 and Core i5 have smaller L3 cache compared to Core i7. But for the purpose of this article, CPU simulation is a valid approach. We will investigate the gaming performance difference between a simulated CPU and a real CPU in a separate article.
For the benchmarks, Crysis 3, The Witcher 3, and Grand Theft Auto V were tested. Three games may seem very limited compared to what we and other review sites usually do, but we believe our choice of games is a good representative of the games currently being played by the gaming community.
Frame rates and frame times of a 60-second game play were recorded using FRAPS. The test results are the average of 3 benchmark runs and 2 benchmark sequences will be used for each game.
The game settings used for each game are shown below:
Crysis 3
Resolution: 1920 x 1080
Texture Resolution: Very High
Anti-aliasing: SMAA 2Tx
System Spec: Very High
Anisotropic Filtering: 16x
Motion Blur: Disabled
The Witcher 3
Resolution: 1920 x 1080
Frame Rate: Unlimited
Nvidia HairWorks: Off
Number of Background Characters: Ultra
Shadow Quality: High
Terrain Quality: Ultra
Water Quality: Ultra
Grass Density: Ultra
Texture Quality: Ultra
Foliage Visibility Range: High
Detail Level: Ultra
Motion Blur: Off
Blur: Off
Anti-aliasing: On
Bloom: On
Sharpening: High
Ambient Occlusion: SSAO
Depth of Field: On
Chromatic Aberration: Off
Vignetting: On
Light Shafts: On
Grand Theft Auto V
Ignore Suggested Limits: On
DirectX Version: 11
Resolution: 1920 x 1080
FXAA: On
MSAA: Off
NVIDIA TXAA: Off
Pause Game on Focus Loss: On
Population Density: Maximum
Population Variety: Maximum
Distance Scaling: Maximum
Texture Quality: Very High
Shader Quality: Very High
Reflection Quality: Very High
Reflection MSAA: Off
Water Quality: Very High
Particles Quality: Very High
Grass Quality: High
Soft Shadows: Softest
Post FX: Very High
Motion Blur Strength: Off
In-game Depth of Field Effects: On
Anisotropic Filtering: x16
Ambient Occlusion: High
Tessellation: Very High
Long Shadows: On
High Resolution Shadows: On
High Detail Streaming While Flying: On
Extended Distance Scaling: Maximum
Extended Shadows Distance: Maximum
Starting in this article, we would now be showing what section of the games we benchmark. Some review sites only describe the part of the game they benchmarked. Here at Back2Gaming, we believe it is better to show videos of the benchmark sequence so it would be easier for our readers to replicate our benchmarks for verification purposes.
Crysis 3 – Welcome to the Jungle
Crysis 3 – Post Human
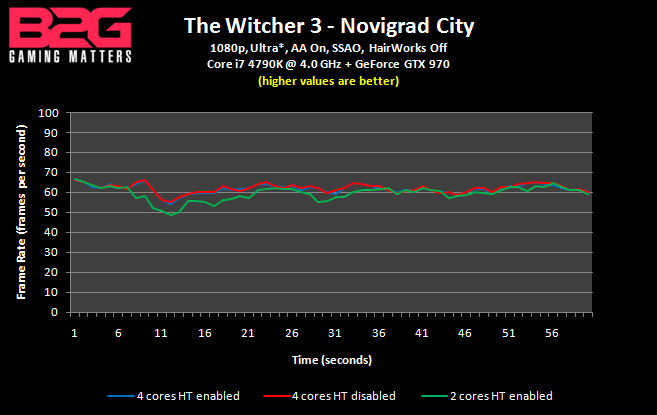
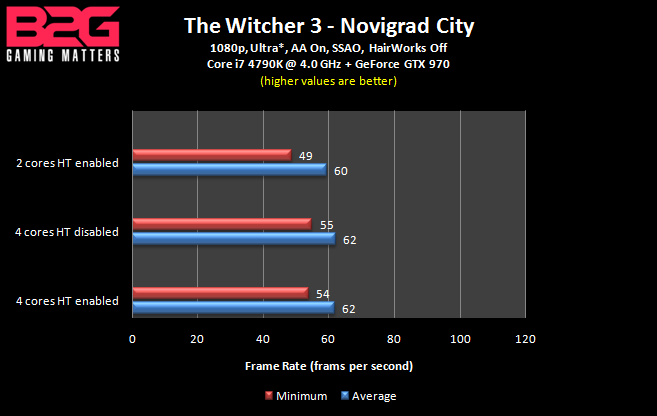
Witcher 3 – Novigrad City
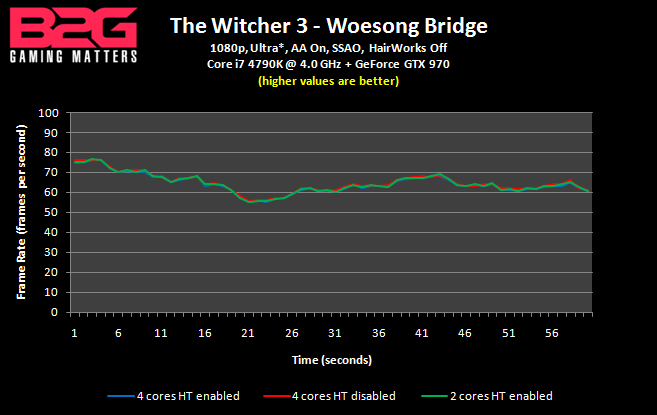
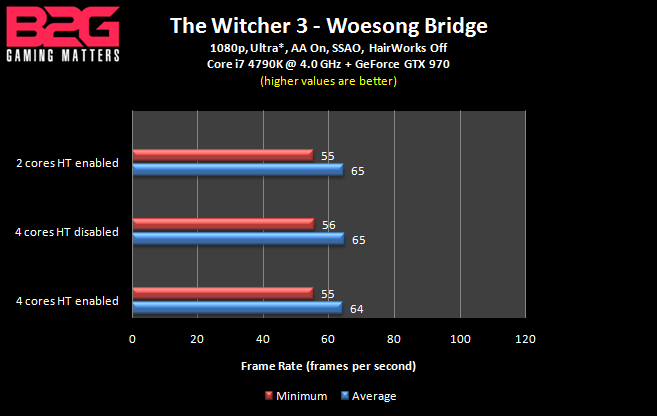
Witcher 3 – Woesong Bridge
Grand Theft Auto V – Rockford Hills
Grand Theft Auto V – Palomino Highlands
Frame Rate Test Results
If ever there is only one game that we can use for benchmarking, it would be Crysis 3. It is a great game for testing CPU’s and GPU’s. When 2 CPU cores of Core i7 4790K are disabled, the average frame rate in Welcome to the Jungle is 35% lower compared to the average frame rate in Post Human. With the the default configuration of Core i7 4790K, the average rate is almost the same on the 2 levels but the minimum frame rate in Post Human is 17% lower compared to the average frame rate in Welcome to the Jungle. It shows that the Post Human level is more demanding on the GPU.
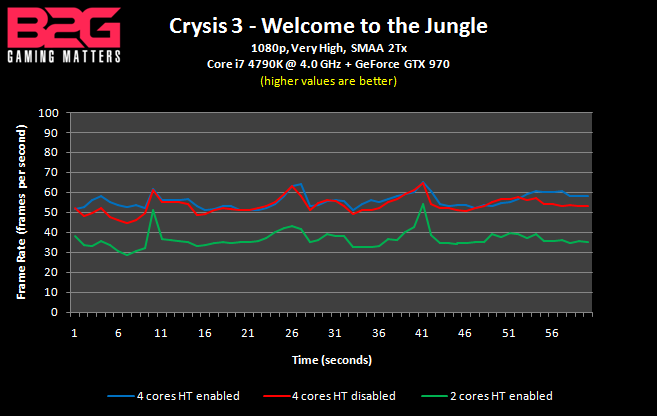
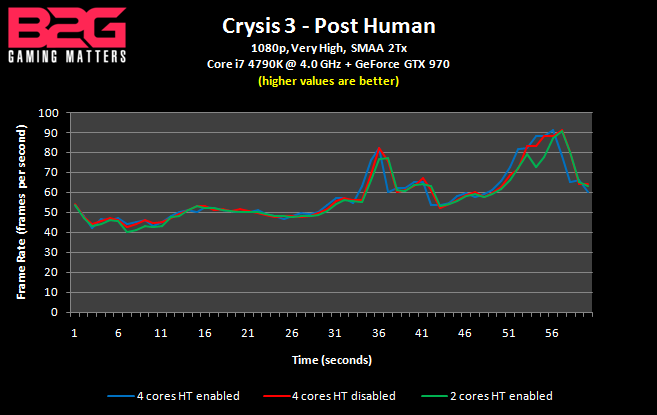
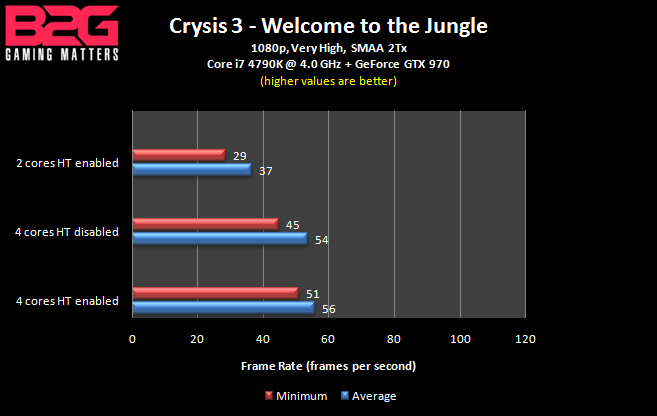
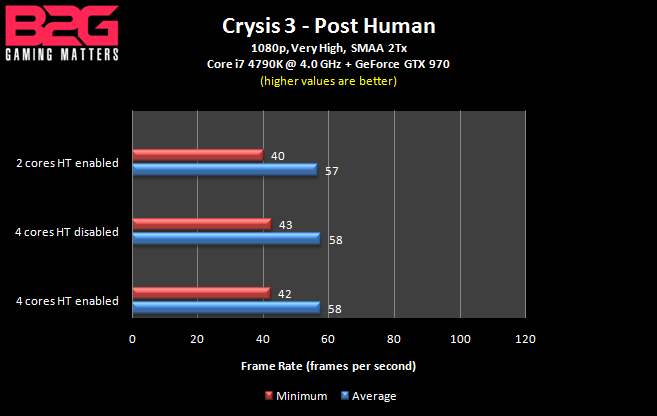
Nothing much to say in The Witcher 3. All CPU configurations delievered almost the same performance in the 2 sections that were tested.
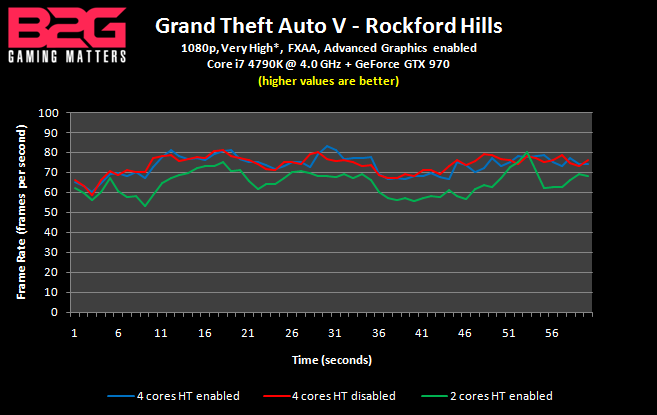
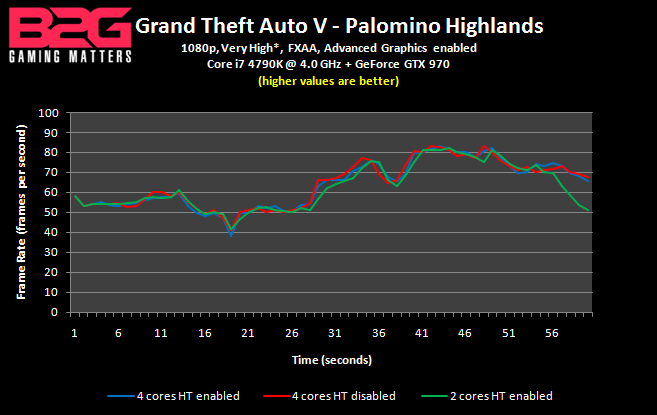
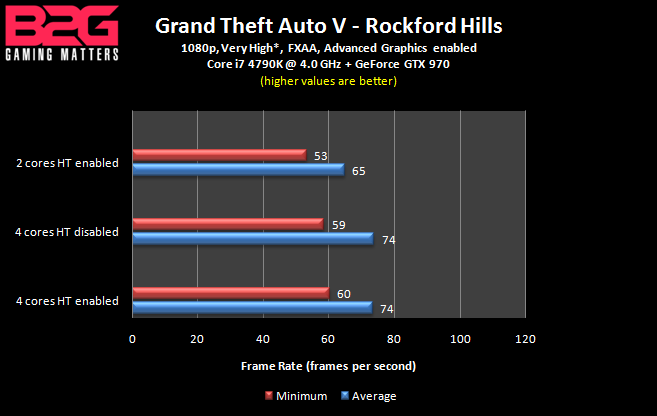
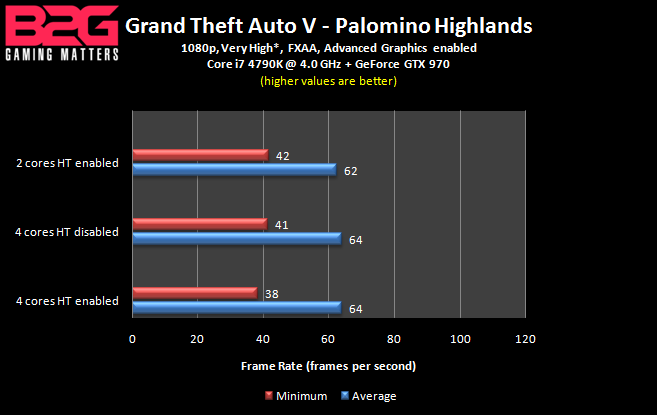
In Grand Theft Auto V, running Core i7 4790K with 2 CPU cores disabled reduced both the average frame rate and the minimum frame rate by 12% in Rockford Hills. All CPU configurations delievered almost the same performance in Palomino Highlands but the average frame rate and the minimum frame rate were lower by 13% and 33%, respectively, compared to Rockford Hills.
Frame Time Test Results
NOTE: Before you proceed, we strongly recommend that you read Tech Report’s article on frame time benchmarking. In case you want to skip reading that article, here is a quick lesson on how to read the frame time results.
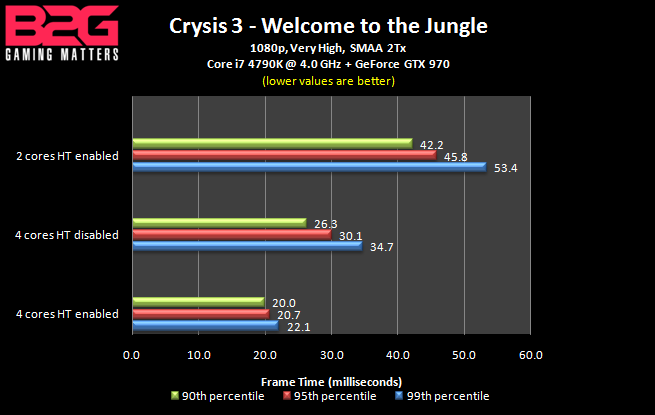
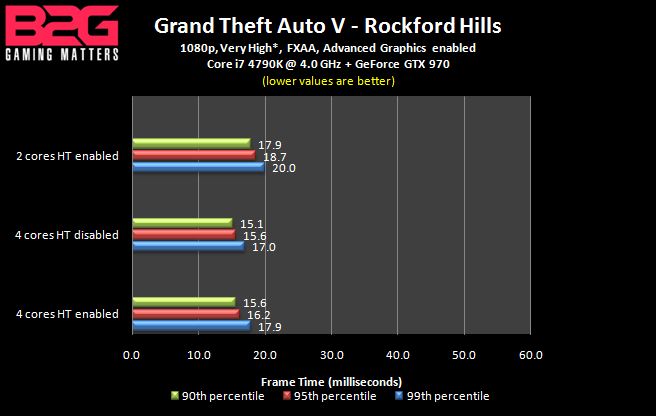
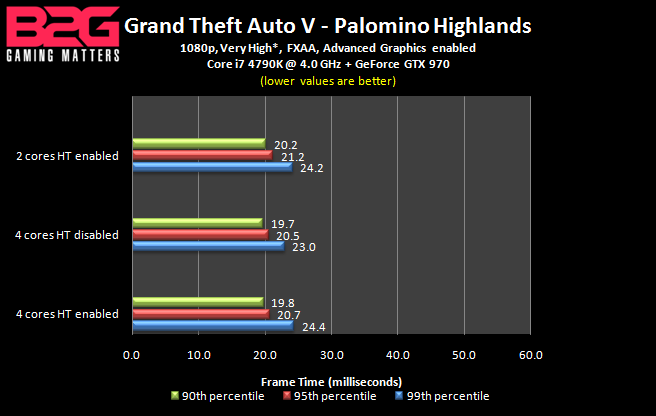
First, you should know how the average frame rate is computed: The average frame rate is equal to the total number of frames rendered divided by the benchmark length in seconds. For example, if there is a total of 3,500 frames rendered during a 60-second benchmark, the average frame rate will be 3,500 / 60 = 58 frames per second. The time it takes for each frame to be rendered is called the frame time. A 99th percentile frame time of 25 ms (milliseconds) means that 99% of all the frames are rendered within 25 ms. In the example of 3,500 frames, a 99th percentile frame time of 25 ms would mean 3,465 frames (3,500 x 0.99) are rendered within 25 ms and a 95th percentile frame time of 22 ms would mean 3,325 frames (3,500 x 0.95) are rendered within 22 ms. Ideally, we want the 99th percentile frame time to be 33 ms or lower.
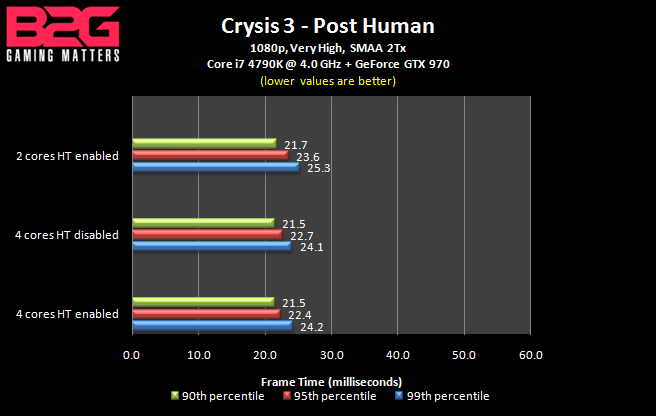
Based on the percentile frame data in Crysis 3, the difference between the 2 levels and the difference among different CPU configurations are much more pronounced. In Welcome to the Jungle, disabling Hyper Threading of Core i7 4790K increased the 99th percentile frame time by 57% while disabling 2 CPU cores of Core i7 4790K caused a 141% increase in 99th percentile frame time. With the the Hyper Threading of Core i7 4790K disabled, the 99th percentile frame time in Welcome to the Jungle is 45% higher compared to that of Post Human. There is frequent stuttering in Welcome to the Jungle which makes the game unplayable when 2 CPU cores of Core i7 4790K are disabled.
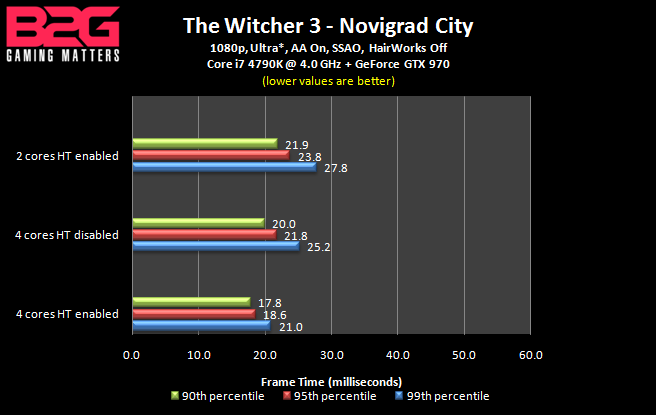
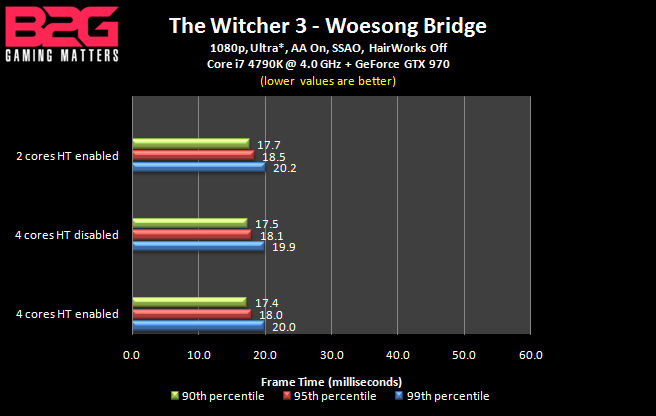
While not as demanding on the CPU like Crysis 3, we can see that the CPU also matters in The Witcher 3. Disabling 2 CPU cores of Core i7 4790K increased the 99th percentile frame time by 32% in Novigrad City but the game is playable on all CPU configurations.
All CPU configurations delivered a smooth gaming experience in the 2 sections of Grand Theft Auto V that were tested. However, it should be noted that in Rockford Hills, the GPU usage drops to around 80% when 2 CPU cores of Core i7 4790K are disabled. Comparing the 99th percentile frame times of the 2 levels, Palomino Highlands is 36% higher than Rockford Hills when Core i7 4790K is in the default configuration. It shows that the Palomino Highlands area is more demanding on the GPU.
Final Words
With the frame rates and the frame times of the games we tested, we hope that you now understand how important the test methodology is. It’s possible to get largely varying results depending on the section of the game that was benchmarked. There are games that have a section which are very demanding on the CPU and others have a section which will put a heavy load on the GPU. So, what should a review site use for their benchmarks? That depends. If GPU’s are being reviewed, of course, a benchmark sequence that puts the heaviest load on the GPU should be used. In testing how a game’s performance is affected by CPU performance, a benchmark sequence that puts the heaviest load on the CPU should be used. We believe that it is better to show worst-case real-world performance because it’s non-sense to benchmark a section of the game that puts a light load on your system. If you base your purchase decision on a benchmark that puts a light load, you would run into performance problems in the more demanding sections of a game.
The test results we’ve shown today are based only a GeForce GTX 970. In our upcoming article, we will apply our new game benchmark methodology using Intel Skylake CPU’s (LGA 1151) partnered with various GPU’s from different price brackets. Newer games like Rise of the Tomb Raider will also be added for the benchmarks.
BossMac’s Notes: As mentioned earlier, this isn’t conclusive nor definitive in any respect but serves as a guide to show everyone the methodology and concept behind our benchmarking techniques. While we will still be serving up frame-rate based reviews for our general audience, our more technical audience will appreciate the added insight into the benchmarking process and we are looking into including a more comprehensive result graph in the foreseeable future.
For now, let’s get back to gaming.


