A few years ago, frametime testing was introduced to the tech media which allowed us to analyze far more than the average FPS performance in games. While FPS results showed us a basic idea of how graphics card perform in each game, it does not show the full picture of what the experience we liked. With the rise of FCAT and frametime testing came the realization of the tech community that FPS average numbers don’t show the entire picture but this method is wholly reliant in a benchmark that is actually reliable.
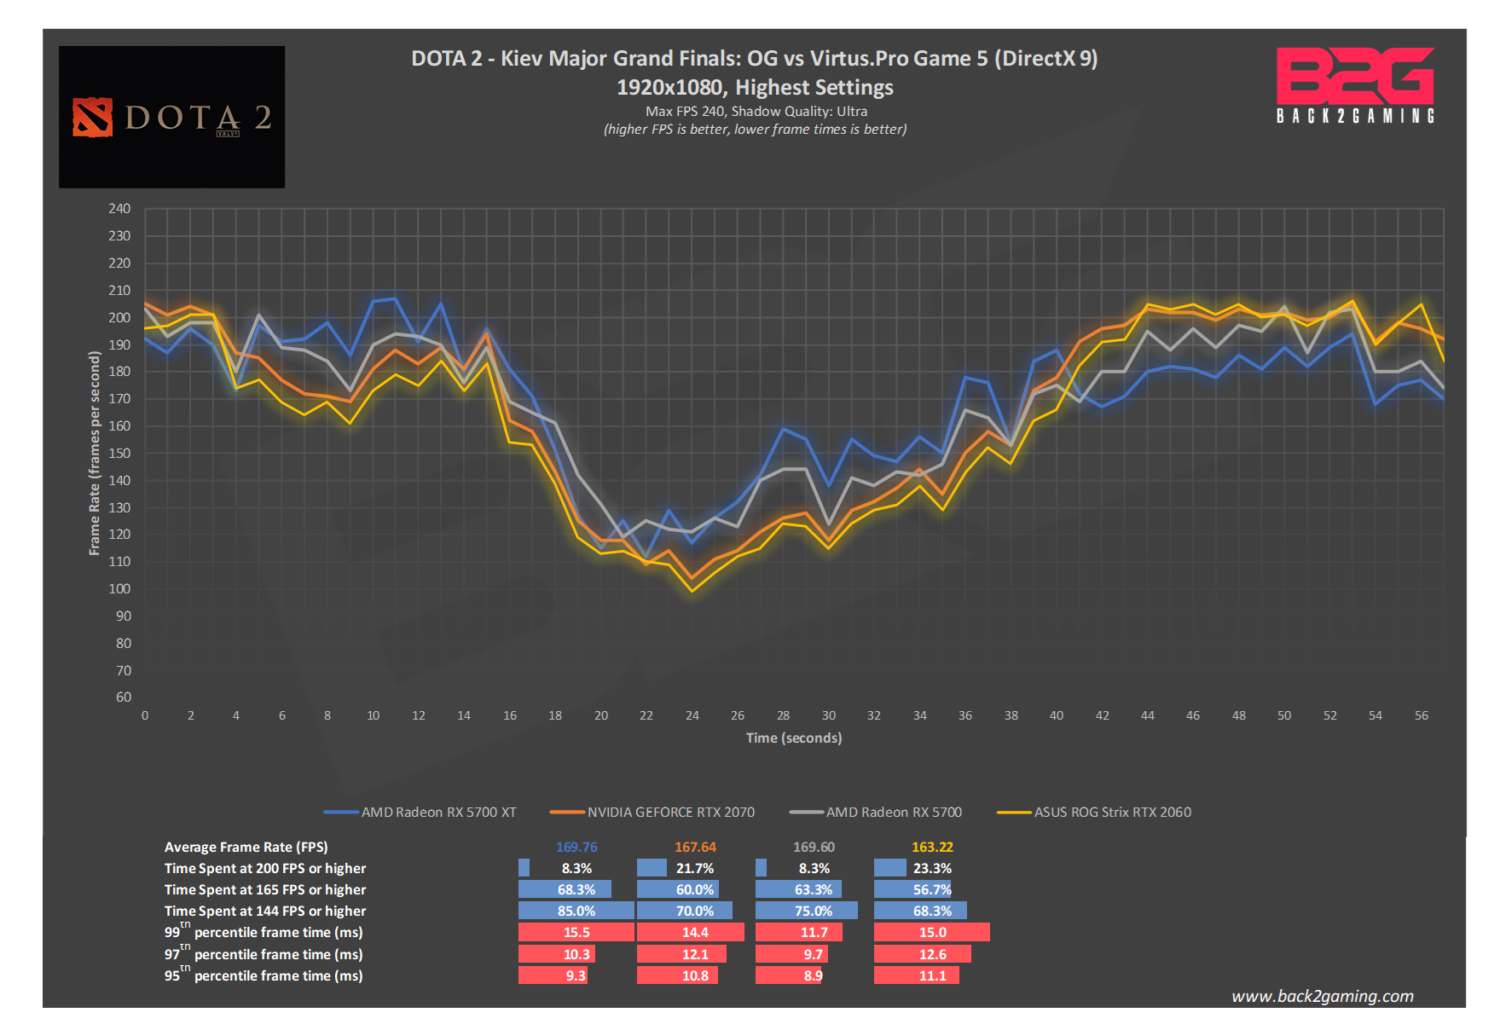
Take the chart below as an example:
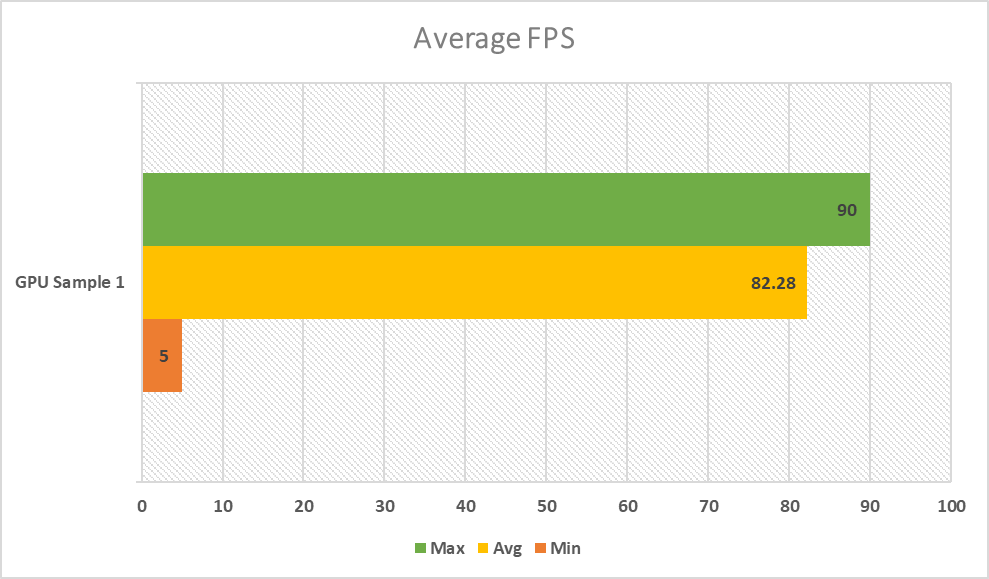
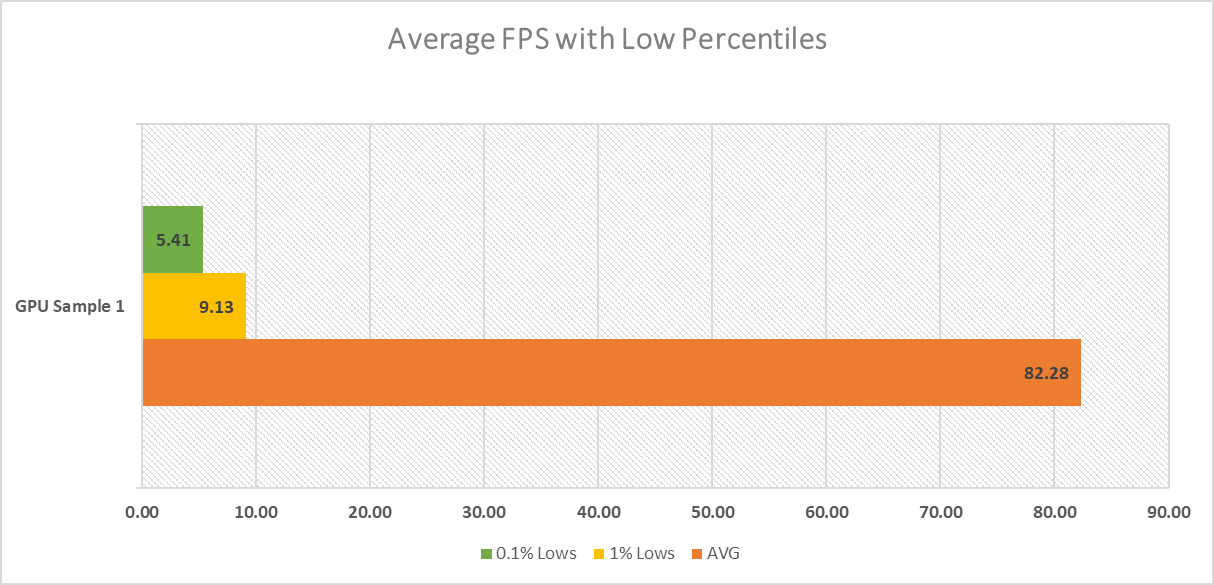
In the chart above we can see a couple of things. The first one of course is the go-to results for most of tech readers, which is the average FPS. To give context to how good a card is, we match it to set number of graphics card of course. But let’s isolate the data first and give context to what we have right here.
The chart above shows us en example of a very confusing chart. The high average which is close to the maximum FPS leads us to believe there is some capping involved and the very low FPS is something that needs to be detailed further by the reviewer to give context to what the results mean. In this article, we’ll share with you more details about how we benchmark graphics cards and CPUs to measure gaming performance.
We covered much of the detail of how we test a couple of years ago in our methodology article and this piece is aimed to updated that with more detail.
How We Test Games: A Prelude
Before we start benchmarking, we have to choose the games we benchmark with. I personally have 3 criteria that a game has to meet before I use it as a benchmark:
- A game has to be a popular representative of its genre
- A game has to be a technological demonstration of its platform
- A game has to have a sizable, long-standing player-base
With those in mind we have chosen these games as our benchmarks of choice:
- DOTA2 (DirectX 9) – arguably the most demanding MOBA out right now with a very large playerbase
- F1 2017 (DirectX 11) – we needed a racing sim and F1 2017 is a decent representative of its genre*
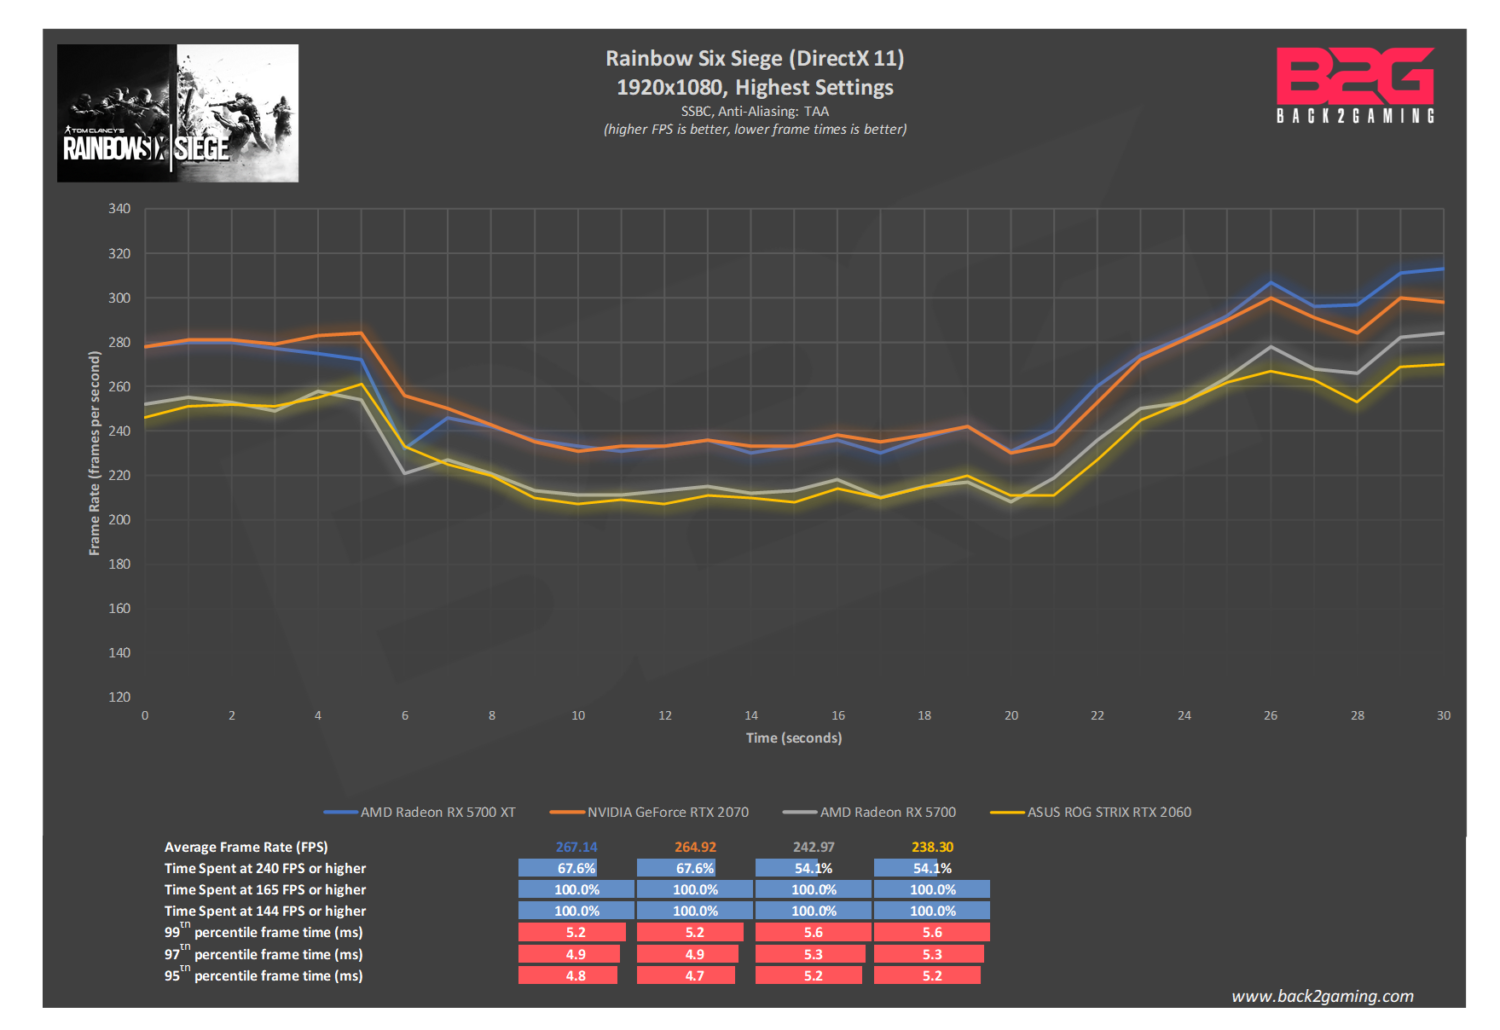
- Rainbow Six Siege (DirectX 11) – ticks all our criteria box and a nice FPS that saw quite the resurgence
- Grand Theft Auto V (DirectX 11) – large playerbase, great tech demo for vast areas
- The Witcher 3: The Wild Hunt (DirectX 11) – good graphical demo of its genre and quite popular as well. Thanks Henry Cavill!
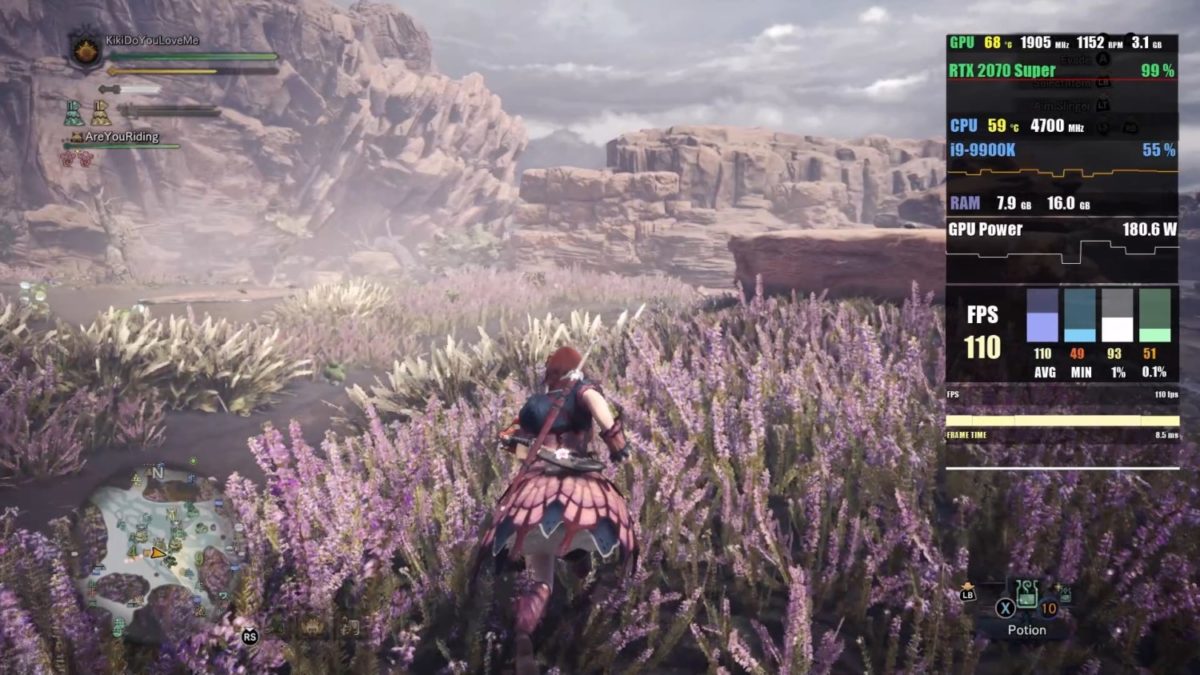
- Monster Hunter World: Iceborne (DirectX 12) – sizable playerbase and resource intensive**
- Shadow of the Tomb Raider (DirectX 12) – we’ve used all Tomb Raider reboot titles as they are very well polished games games
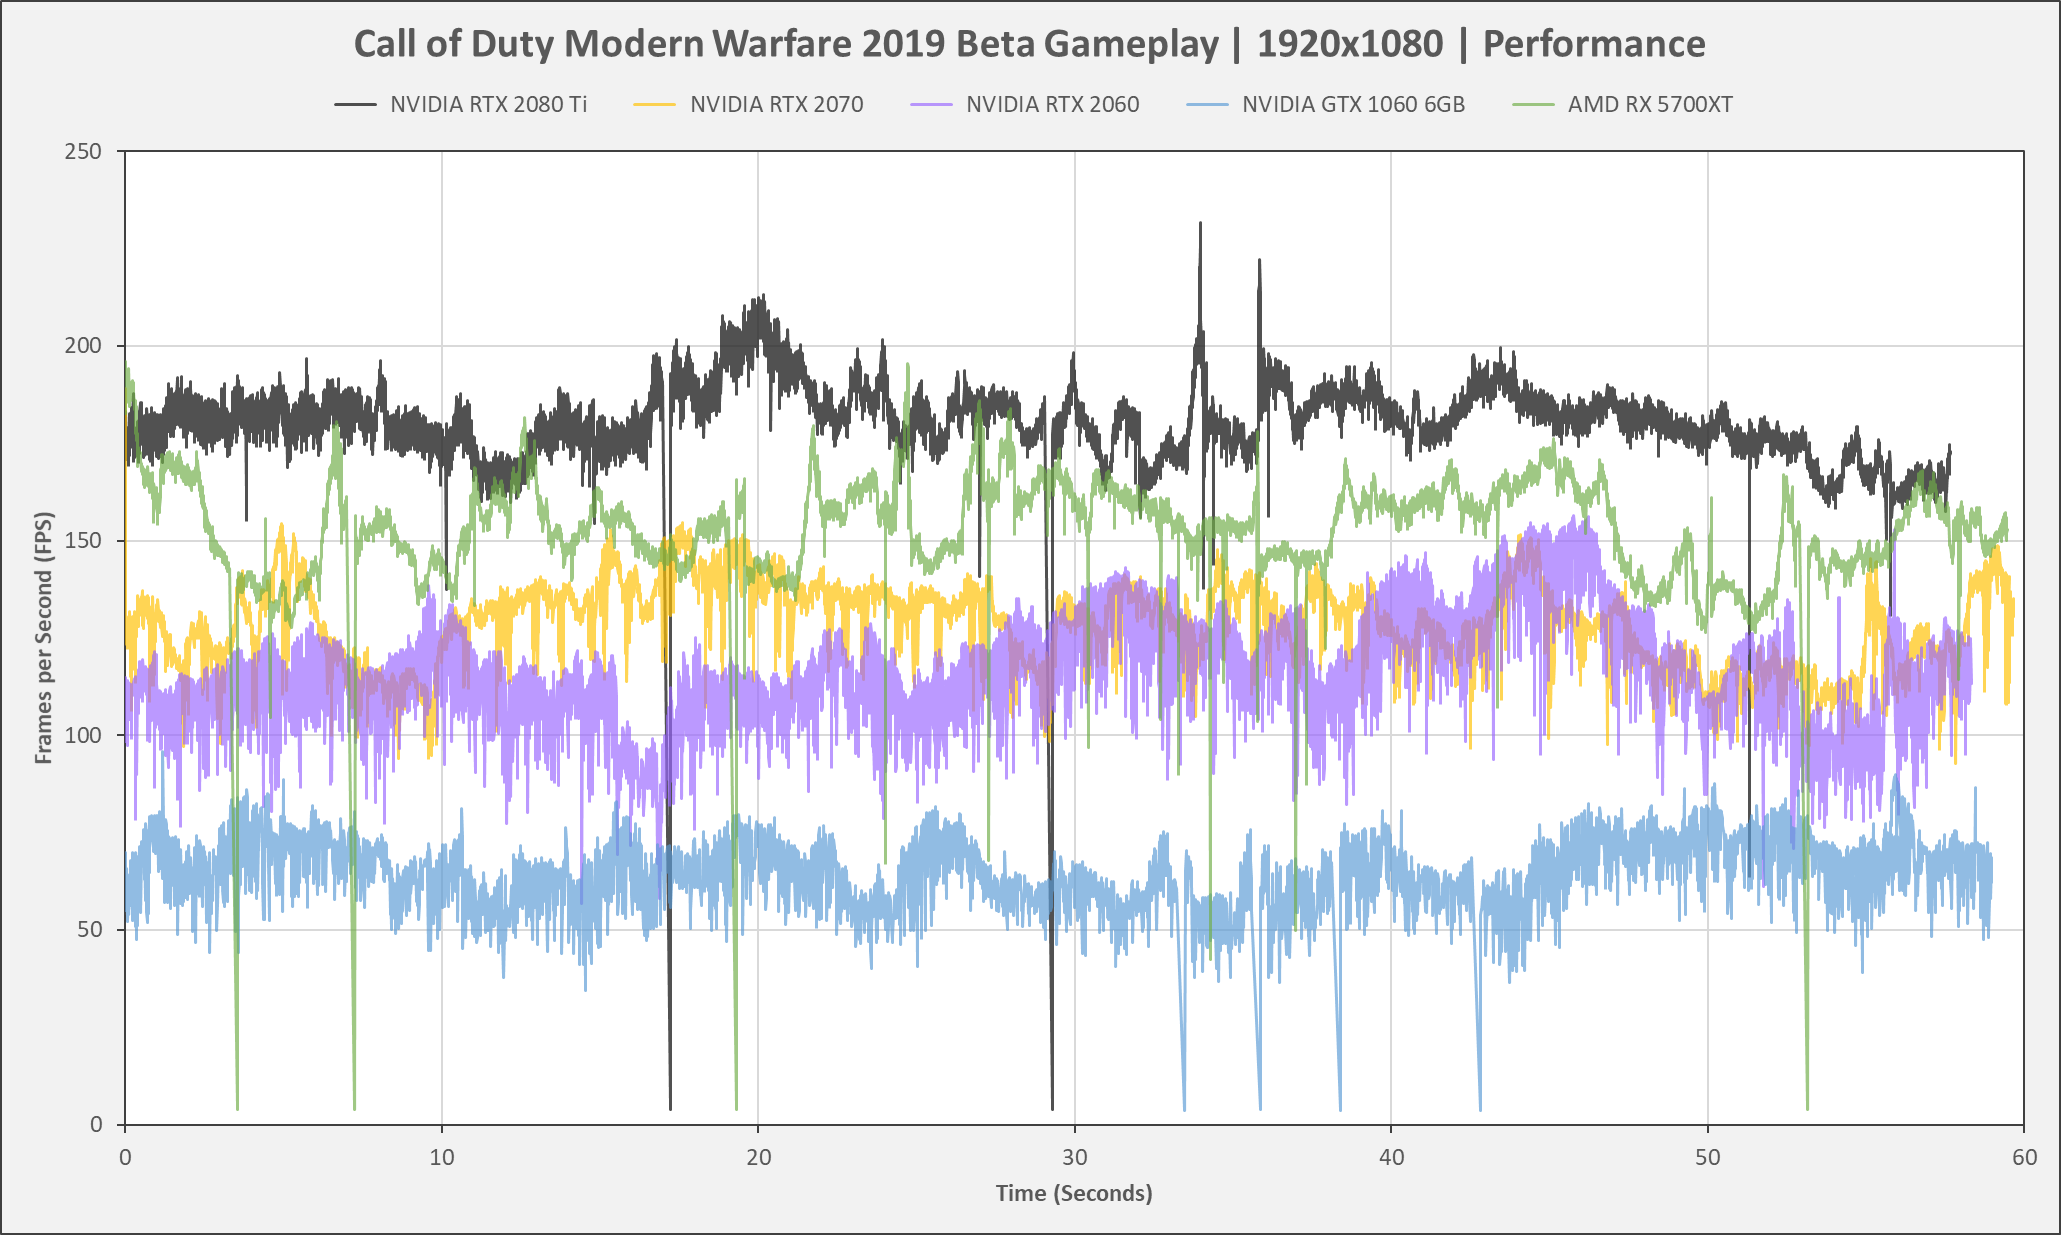
- Modern Warfare 2019 (DirectX 12) – the proper tech demo for raytracing and a prelude to what can be in the next generations of games
*as we feel the game has slowed down in improvements, we've yet to choose a newer racing sim to replace this title
**MHW:Iceborne has a lot of variable options that need to be disabled and while the game is not a graphical marvel, its actually beautiful as it is but all the while very taxing to the system
In most instances we select games when they are mature already, meaning once a game has been out for a while, that’s when we choose to use them as benchmarks. We do not use games during their first months to avoid disparity. There are games that we want to use as benchmarks but present no logical way to benchmark uniformly and present too many variables to test consistently. Examples of these are PUBG, Overwatch, and mostly online games that just don’t have repeatable areas for testing.
Once a game has been chosen, we need to pick a benchmark sequence. We absolutely try to avoid canned in-game benchmarks in games but we do have exceptions. Games like Shadow of the Tomb Raider and Grand Theft Auto V have in-game benchmarks but these have split sequences that do not fit our requirements for a 1-minute constant scene. That said, these are unusable for us.
Another reason is driver optimization by graphics cards vendors when using canned benchmarks. While there’s no definite proof that NVIDIA and AMD may be cheating with their current drivers, history has shown that is has happened and we hate to invalidate benchmarks results if and when it happens.
The final reason is that in-game benchmarks do not necessarily represent in-game experiences. With that said, we try to use in-game areas as much as possible. To choose benchmarks, we take time playing our games and familiarizing ourselves with the mechanics of how graphics affect the gaming experience. Taking from that, we also analyze which area puts a reasonable load on the game.
For DOTA2, we have their replay viewer which actually replays the game is happens in the engine, reenacting frame-by-frame what actually happens. This makes it easier for us to repeat benchmarks for DOTA2 and make it as accurate as possible with time stamps and even repeatable viewports. Some have argued that playing the game is the better benchmark and we have tested gathering benchmarks from a real-game and comparing it with the replay playthrough and the difference are negligible.
For Rainbow Six Siege and F1 2017, we use the in-game benchmarks. The reason is quite simple: both games in-game benchmarks are continuous timedemo sequences which are actually quite representative of in-game experiences. One thing to note though, in online games like Rainbow Six Siege, network latency plays an issue as well and when a game suddenly disconnects or lags, even for a second, this may affect benchmark results. The in-game benchmark does not suffer from this.
You can check out our large archive of gameplay benchmarks we’ve used or are still using in our video playlist:
Graphical Details Dilemma: High or Max
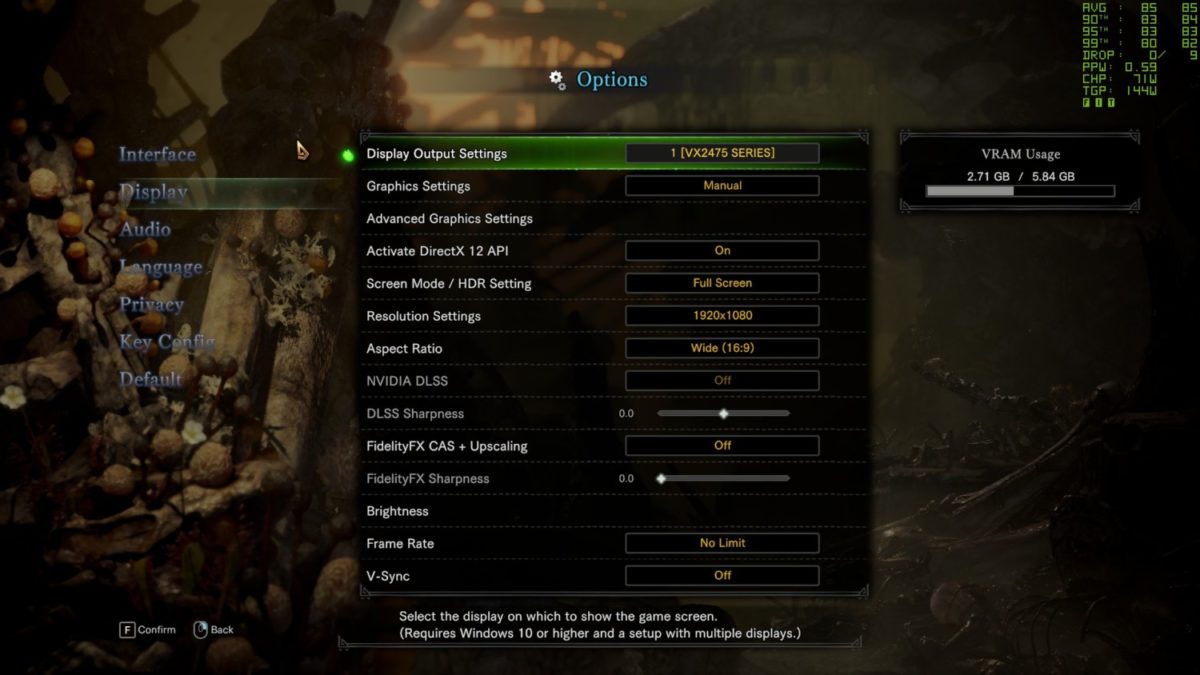
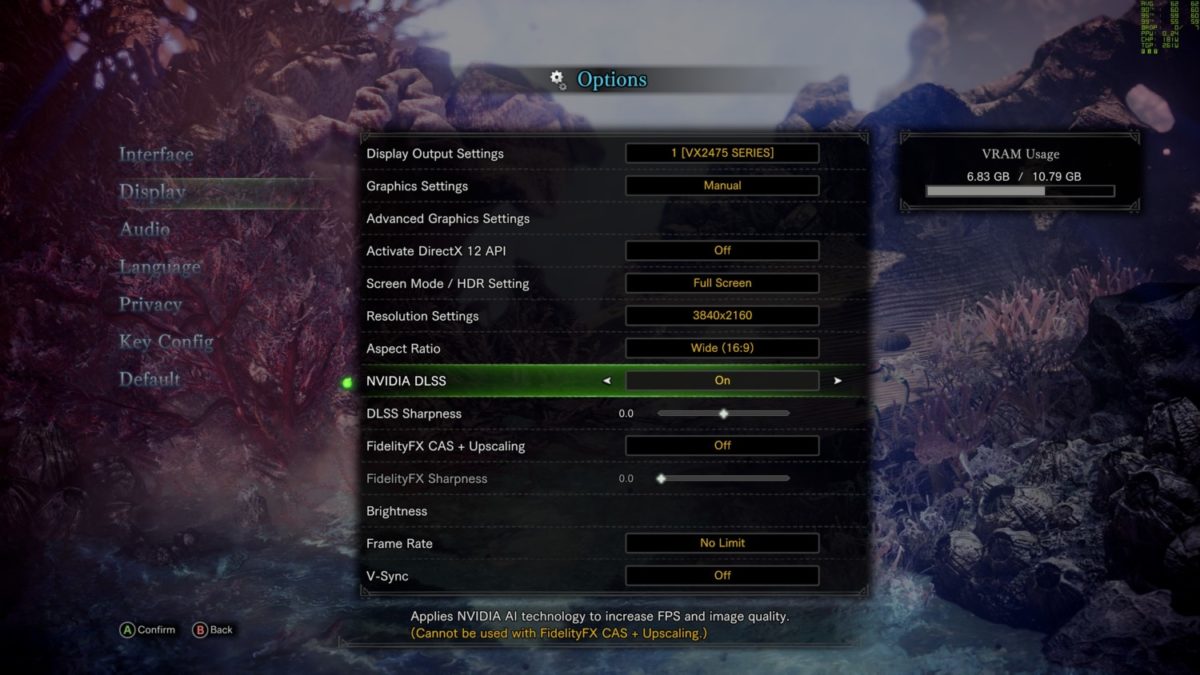
There are exceptions to this rule and we do manually change some settings in some games like GTA V where we keep the Advance Graphics Details to minimum and put everything in Very High. Some games like Monster Hunter World have variable resolution settings which we need to set to a fixed value to make sure we’re getting consistent results. Dynamic resolution means that the game uses variable resolutions for details in the game so it runs smoother than some, this behaves quite unpredictably and presents unknown variables for testing. Lastly, there’s proprietary details like ASSAO, TressFX, CSAA, etc. we disable these options to remove performance bias in games as these are technologies unique to a vendor and may affect results. We also disable motion blur in FPS games as it presents inconsistencies during movement.
If a game has a graphical preset profile, we will use that in most instances but change details as highlighted in the previous paragraph. Some games, even in their ultimate settings, do not set details to max for their own reason and we choose to retain those unless we feel otherwise. Example of this is Shadow of the Tomb Raider whose Very High detail profile only sets Anisotropic Filtering to 8x. We let it retain that setting to make it easier for reader to replicate settings.
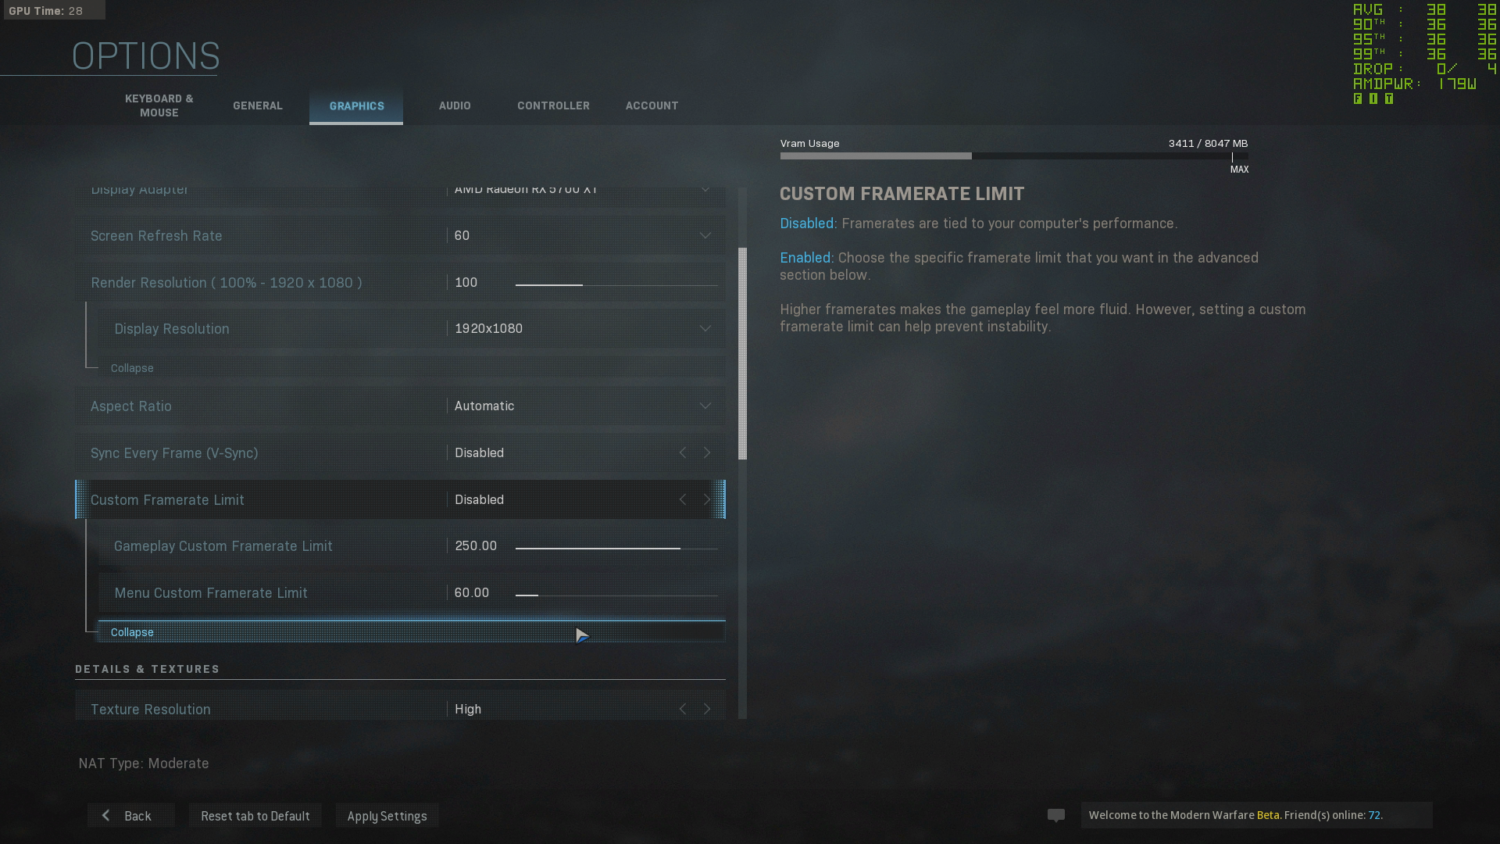
We usually list settings in our benchmark settings but we will try to include screenshots in all reviews going forward.
Games sometimes will have API selections for DirectX 9, DirectX11 or Vulkan or later games, DirectX 12. We will usually run with the default API of the game but if DirectX 12 is present, we will choose that in most instances.
Benchmark Process: Preparing the Test Bench
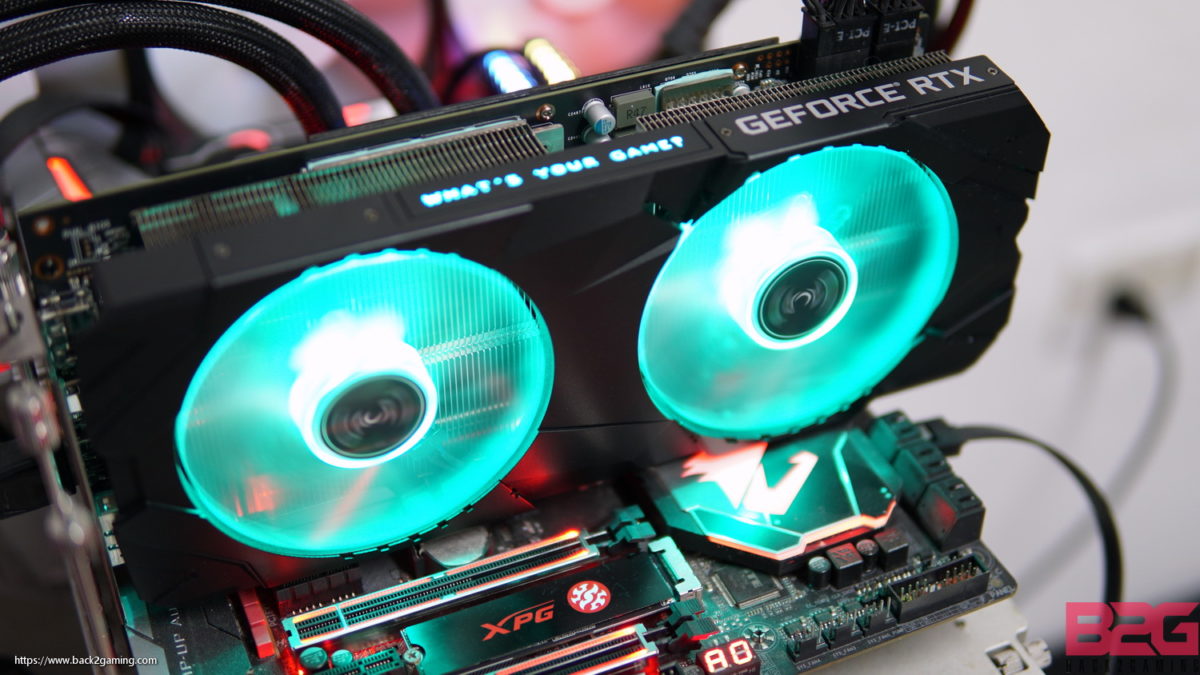
Our reviews usually focus on showing the performance of graphics cards by removing all possible bottlenecks. That said, we opt to use the most indicative gaming performance system available to us. We have upgraded our test bench to the latest Intel CPU for MSDT every year for the past 8 years to use as our primary system as Intel has shown that it is the primary system for gaming. That’s recently changed, and by 2020 if and should AMD release a higher-performing gaming card, we will gladly swap our Intel system out. As we do not stockpile data, it doesn’t affect our workflow.
For other components like memory size, we try to keep it to a modern standard so complimenting components are configured to what’s currently on the market.
Our physical test bench is setup on an open bench table. This allows us to quickly and easily deploy each tests and access the graphics card. It also removes variables introduced by the chassis. We’re currently reconsidering this approach though but for the thermal reading section of our review only.
The software we use for our performance reviews vary, for GPU testing we primarily use FRAPS. Fraps has been a longstanding benchmark and captures frame rate data. We use the frametime results from Fraps to show data in our benchmarks earlier last year. We changed to FrameView, which captures FrameTimes only but we’re currently developing our data presentation for it. More on this in our presentation segment.
In terms of other software, we install everything on a latest install of Windows 10 Pro edition. Any and all start-up programs are removed or disabled and the system is maintained as sanitized after games installations. After the games install, we also include HWINFO, CPUZ, GPUZ, 3DMark, PCMark10, Afterburner+RTSS and our CPU benchmark folder containing our benchmark apps. After which, the system is imaged via Acronis True Image and stored in our NAS. The system is reimaged after updates for games or OS on schedule but custom software is removed prior to a reimage.
We try to keep drivers updated but remove any 3rd-party app that they may install. RGB software is fine. Speaking of drivers, drivers for the GPUs themselves used on testing will either be the launch drivers provided to us during embargo and/or the latest drivers during the time of testing. This will include its related graphics cards e.g. if the embargoed driver for an NVIDIA card is version 460.55 (example only), that will be the one we use for all test of the other GeForce cards. The same will apply to Radeon drivers.
The Main Event: Actual Testing
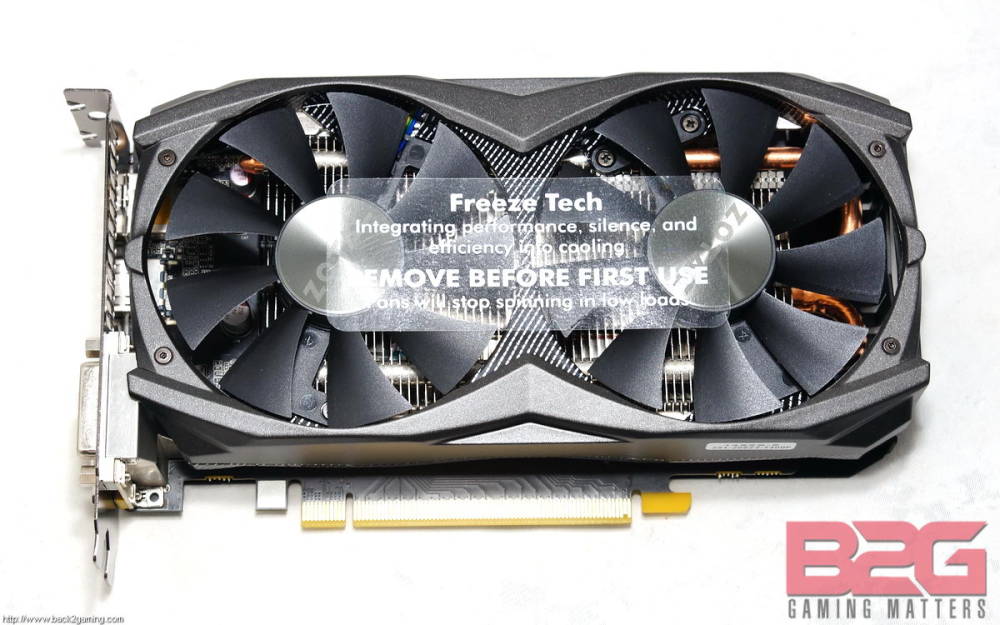
Before we test graphics cards, we actually warm them up first just to shake the factory fresh vibes off the card. This si done via 3DMark Stress Test with Fire Strike Ultra. A DirectX 11 4K Ultra HD benchmark which gives a good load to the card. This benchmarks is also our stress test for the cards temps and power draw but we do that after we do our test. This stress test runs 20 times by default which is the one we use.
Now comes the most time-consuming and laborious part of our review process, the actual testing. We account for possible variance in frame rates so all our tests are done with 3 runs for each resolution. We primarily test in 1920×1080 and we also include 2560×1440 and 3840×2160 for higher cards. But as of the release of the Radeon 5700X, we test all cards in all the 3 resolutions listed above.
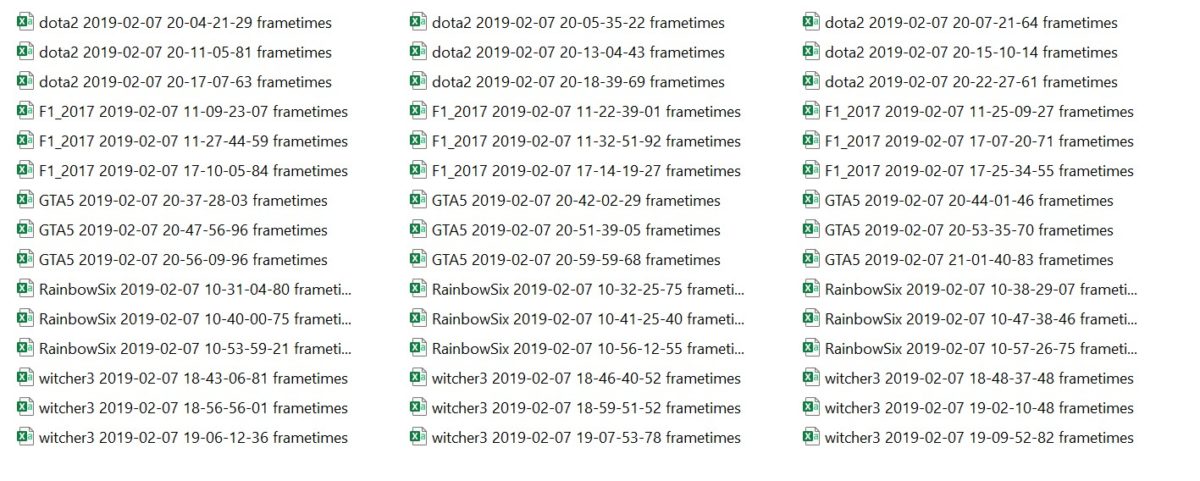
These tests yields a large amount of raw files but its easy to keep track of them as all files are sorted by what graphics card and the actual raw files are named with the game executable filename as well as a timestamp and its easy to logic the resolution as we test chronologically so the first 3 files in date order are 1080p, succeeding 3 is 1440p and the last three are 4K files.
The other reason it takes so long is to keep the test uniform and as the video above shows us, some of these routes are tricky to keep consistent so I have check every so often if I’m keeping the results within acceptable allowances. This is the part of the test that requires the most discipline as it is quite taxing to the one testing. This is why I understand that a majority of reviewers, especially non-specialized ones prefer in-game benchmarks. But as you’ll see later in this article, this actually pays off.
Testing the Data
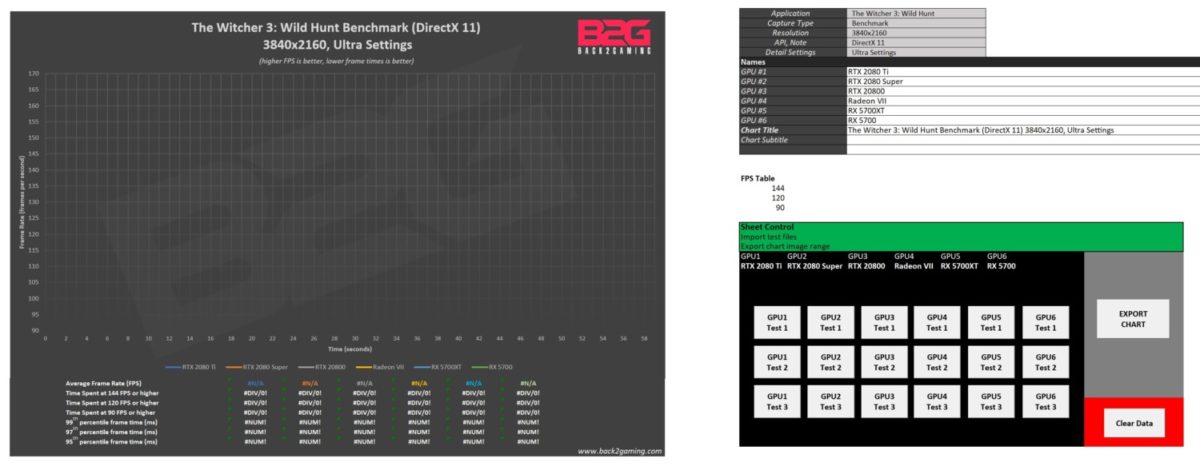
Our benchmark tool is mostly comprised of Microsoft Excel templates that automatically compute the data for us. As you can see, we only need to click buttons in our template to input the data and Excel will the testing. This means I can easily compare data quickly for comparison in our charts up to a maximum of 6 cards.
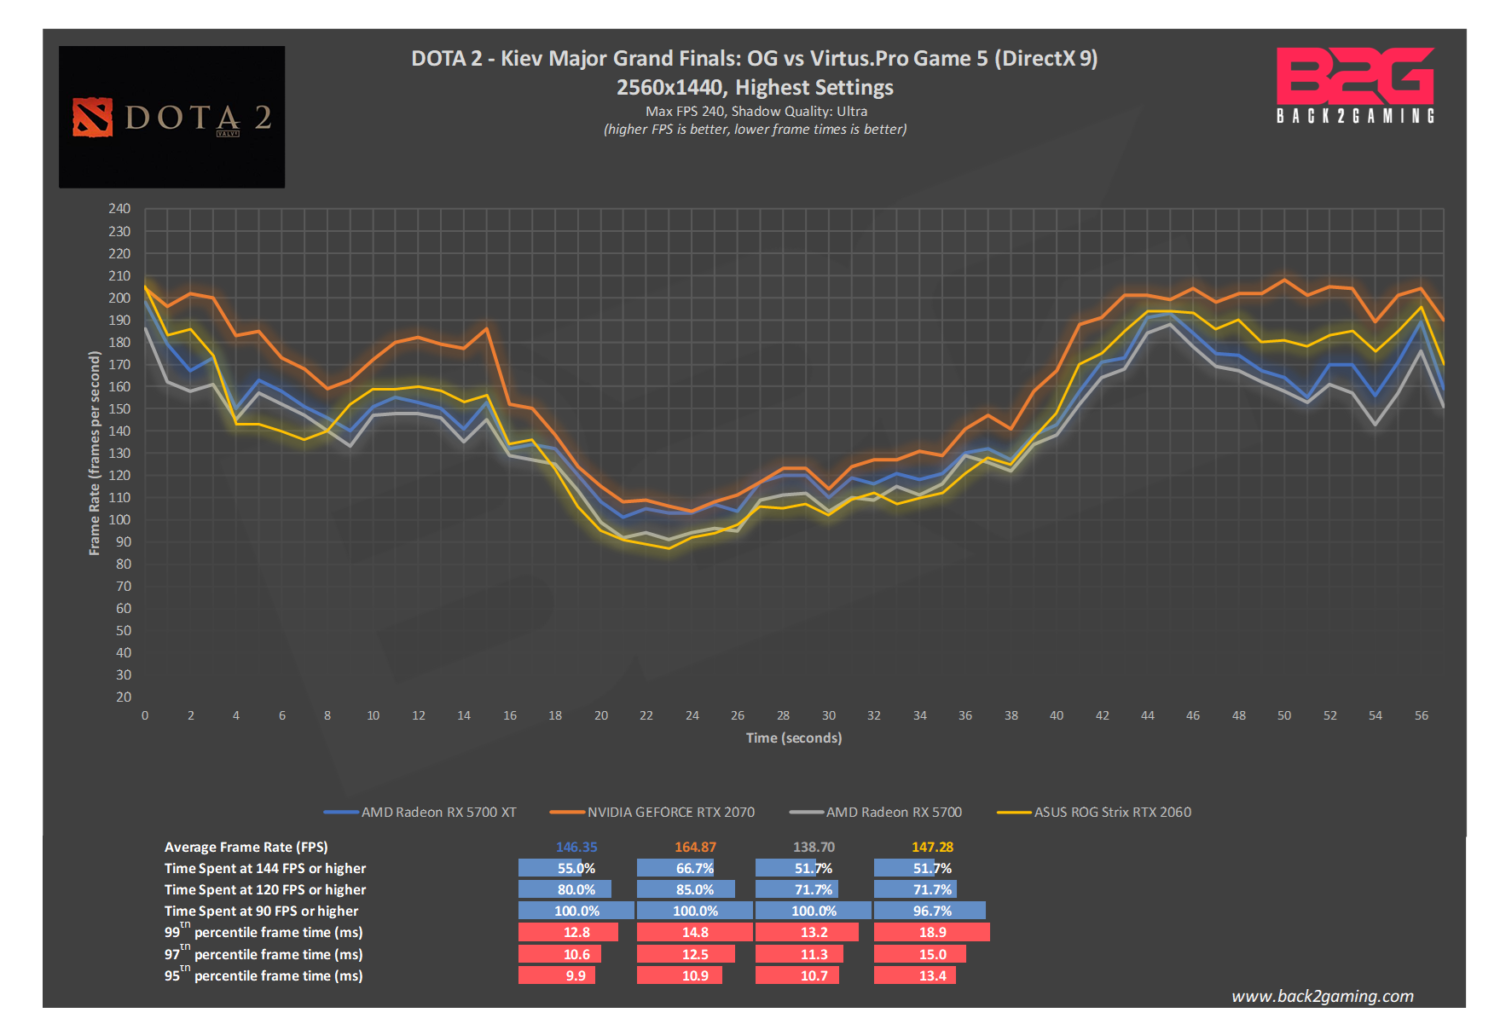
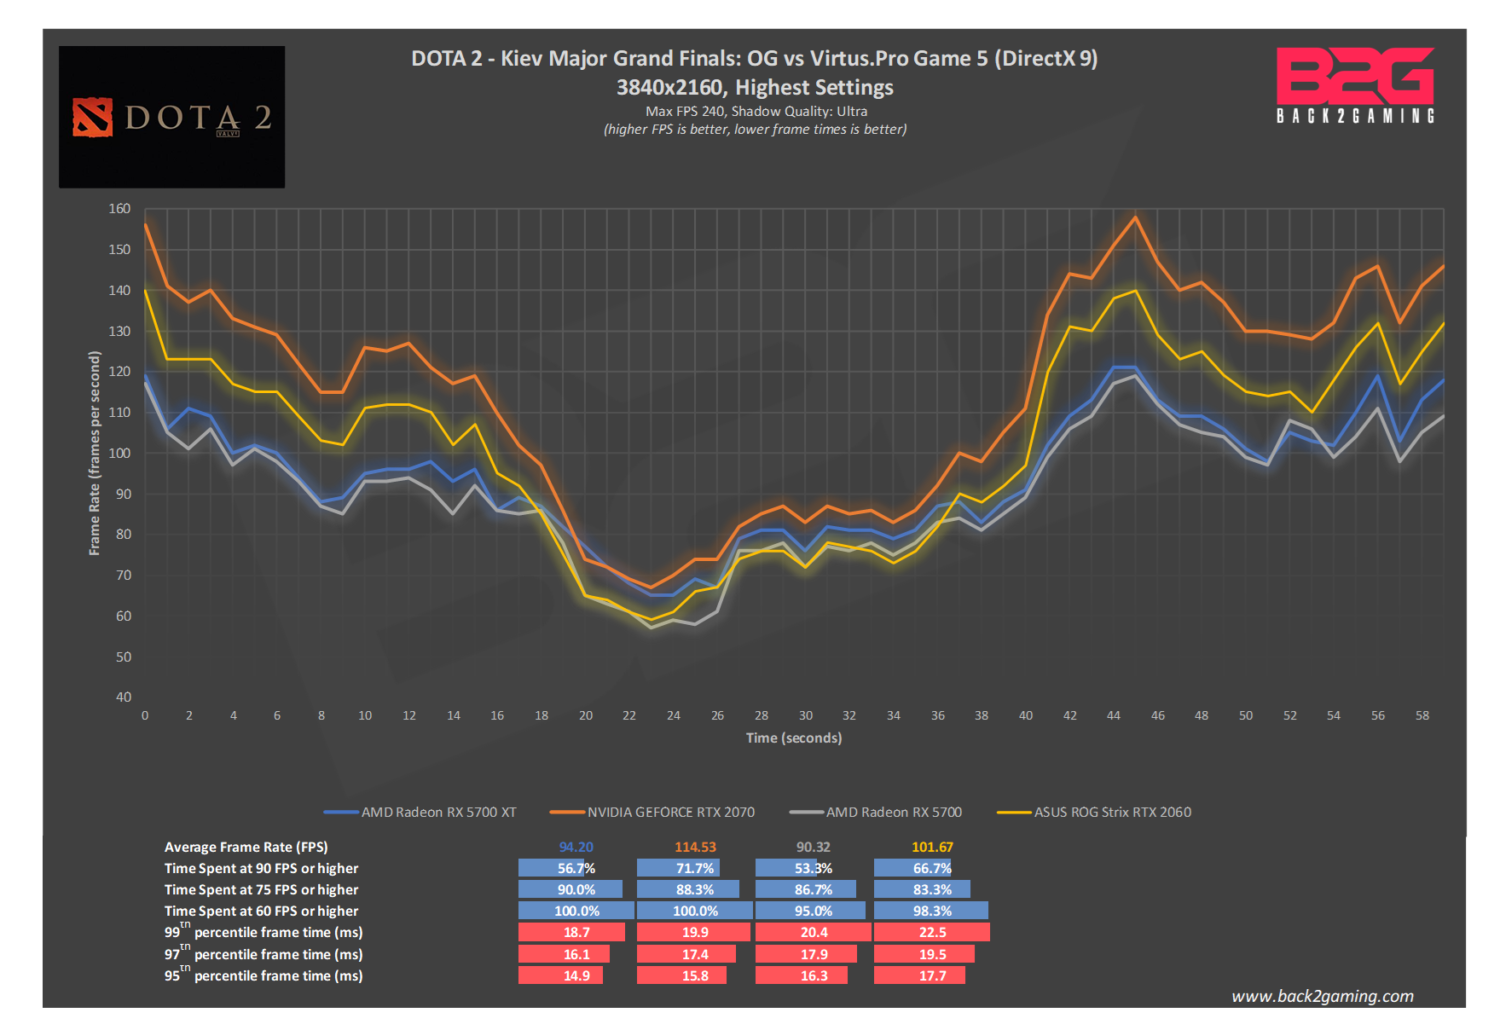
Once final, the chart will look like the results below:
The review template has evolved over time and as mentioned, still not final. But it will still retain the framerate over time which is our preferred method of showcasing performance as it gives a clear and accurate picture of how a card performs alongside its peers. Done perfectly, it shows a perfectly nice comparison against other cards in our chart and the consistency of the data allows us to really present benchmarks as accurate as possible as we have no room to cut corners to maintain the accuracy of these results.
The goal of our reviews is to be as uniform and accurate as possible and while we still work on the data table to better present relevant data, average frame rate in both numbers and chart forms as well as the 99th percentile frame is, what we believe, feels as the most accurate representation of the data that we gather.
Reporting of Data
We’ve outlined our benchmark information and test results in the chart above and that’s pretty much how we present reviews for performance. But let’s clarify a few things first which we presented in the start of this article. Why is traditional Min/Max/Avg FPS reporting misleading?
This is the example that we showed you at the beginning of this article. We noted how curiously skewed this information is but most reviewers will never discuss these results except maybe given this extreme scenario. Let’s look at it at another perspective.
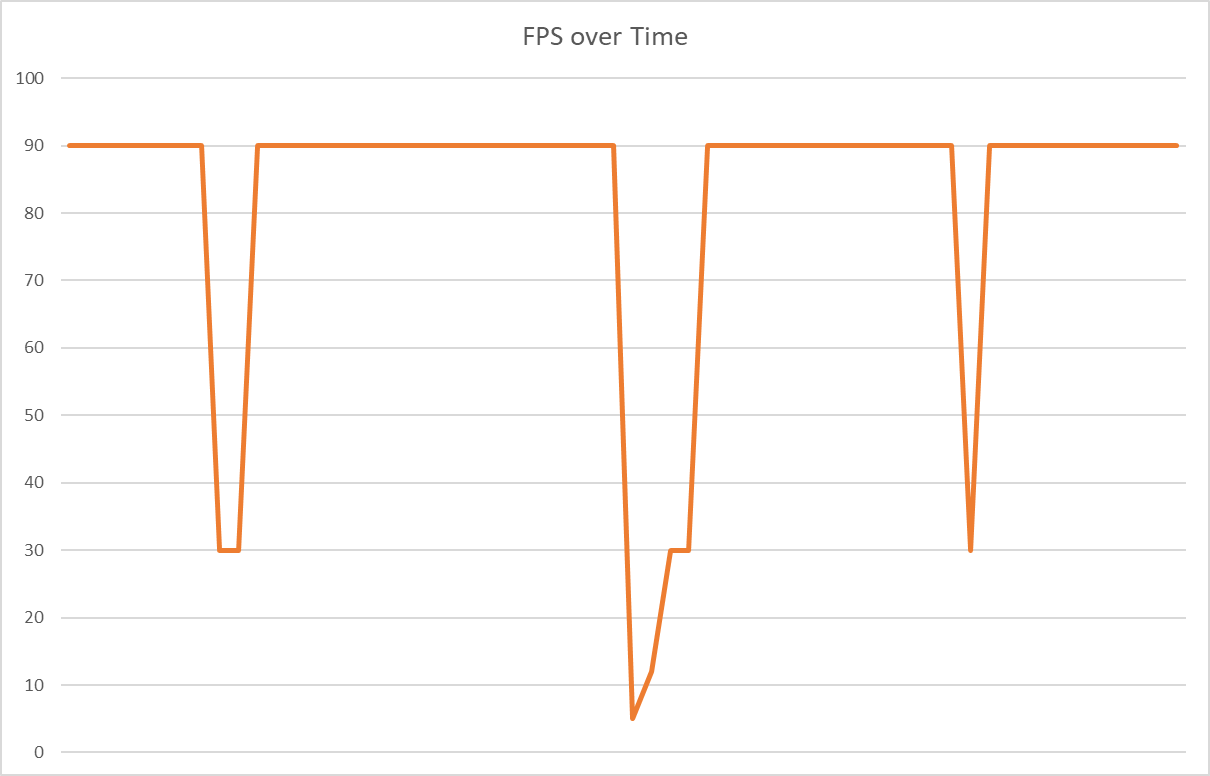
Here is the sample test data above, but on a line graph. Now we have a clearer idea of what the gameplay looks like. The game is smooth and looks capped at 90FPS but dips extremely hard at some points. This kind of behavior in games is usually referred to as stuttering if it occurs too much and may usually be the result of unoptimized drivers or perhaps a bottleneck.
Just by changing the chart, our understanding of the results has changed. Also, our minimum frame rate reading is an outlier. Just a single data point amongst many others but has caused a very alarming reading from our test. Due to this, many media now employ a 99th percentile information or 1% low reading. Simply put, its an average of the lowest frames in the data points, and gives a better view of the information.
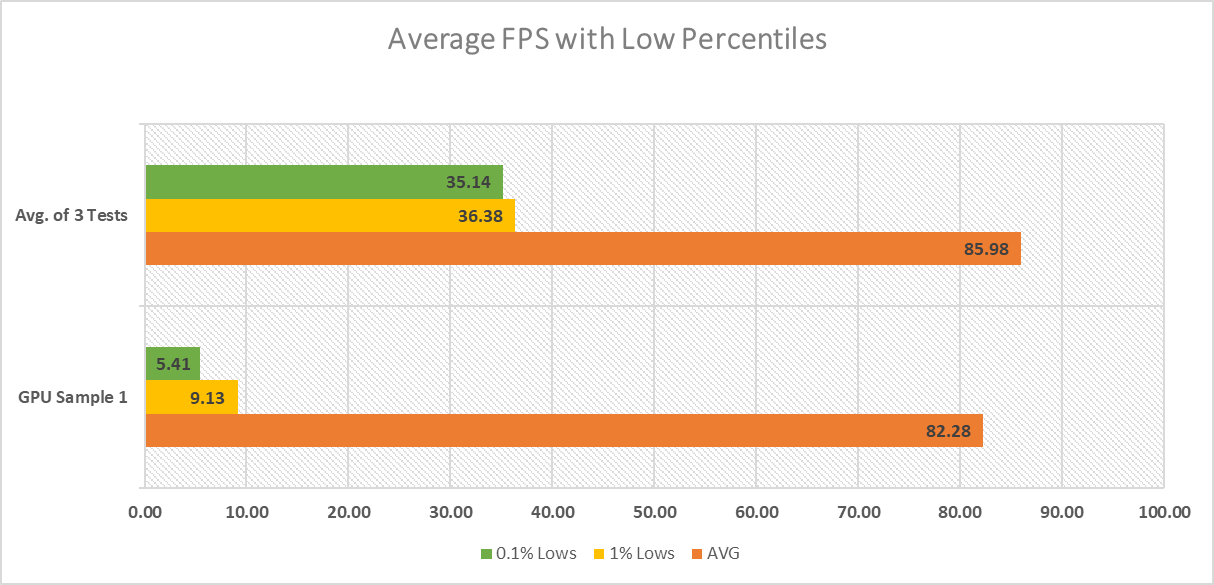
With the minimum FPS varying in most playthroughs, it is better to test with multiple samples.
By averaging multiple test sample data, we see that the game is actually going only as low as 36FPS and that stutter is quite minimal. Still, these charting method is still unclear on how hard the stutter is and how badly it dips from what our average is.
This leads us back to why we choose to include a frame rate over time line graph, to give a visual representation of framepacing. For more precise measurements, we can actually go a bit finer with the details:
Temperature and Power
To test power and temperature, we use 3DMark Fire Strike Ultra stress test. This test is a more realistic representation of gaming workloads versus power viruses like FurMark or Kombustor.
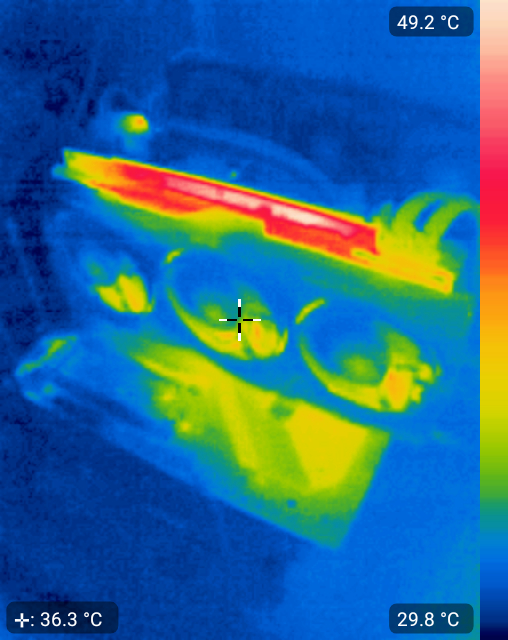
For power reading, we read data off the outlet. Our power meter is the HP-9800 power meter with a USB cable. This feeds data to its own app which is installed in a separate PC that logs the readings per second of the power meter. What we do is capture 15 minute average power draw and then capture the average of our load test. The idle power is deducted from the load reading which should give us a good approximate of our power draw.
Final Words
Obviously, the only way forward is to be as visual as possible. We’ve always admired DigitalFoundry’s technique in sharing benchmarks which is arguably the most exemplary way we can think of presenting not only stutters but overall gameplay. The method presents a lot of challenges in itself including a new workflow and the expense of having the software developed but as Back2Gaming aims to maintain the quality it has always demonstrated over the years, we have to evolve as well. We are currently exploring options, include custom developed solutions in presenting the information that should help us, the brands and especially our audience.
Outside of that, we’ll continue to refine our test in the coming months as well as make it more generally relevant by including results for lower CPUs. We’ve heard it from our readers that majority of reviews are done to showcase graphics card performance and while that will always have its merits, has not always been reflective of the performance that most gamers will see in combination of CPU+GPU, especially in the mainstream- and entry-level market. We are working on a solution to provide both visual and written information about this.
Lastly, we are always thankful to all our readers who have supported us throughout the years. It is through your feedback that we make adjustments to our benchmarks as the results are after all, for you. Also, we’d like to thank all our component partners who make our reviews possible.
If you have suggestions, ideas and questions, drop us a comment.


