Yesterday we posted about our power measurement tool, Powenetics and noted that it has changed the way we address the problem of accuracy of power draw particularly for GPUs. For the longest time, reviewers have relied on complicated meter setups and assumed readings from API and power outlets. I’ve always preferred reproducible numbers that can be tested via peers or by the readers but aforementioned power measurement methods have their own issues to deal with and Powenetics may have improved that for us but its barrier to entry still leaves as a premium solution. Still, the concept exists and the concept works; measuring power draw as it is being drawn directly from the device itself is a the most logical way to measure power draw and this echoes true for NVIDIA as today, they are making their PCAT (Power Capture Analysis Tool) testing tool public.
Members of the press were issued the LDAT and PCAT kits prior to the announcement of the RTX 30 series graphics cards. We have coverage for LDAT as well as FrameView v1.1 in their own articles, make sure to check those out if you’re interested.
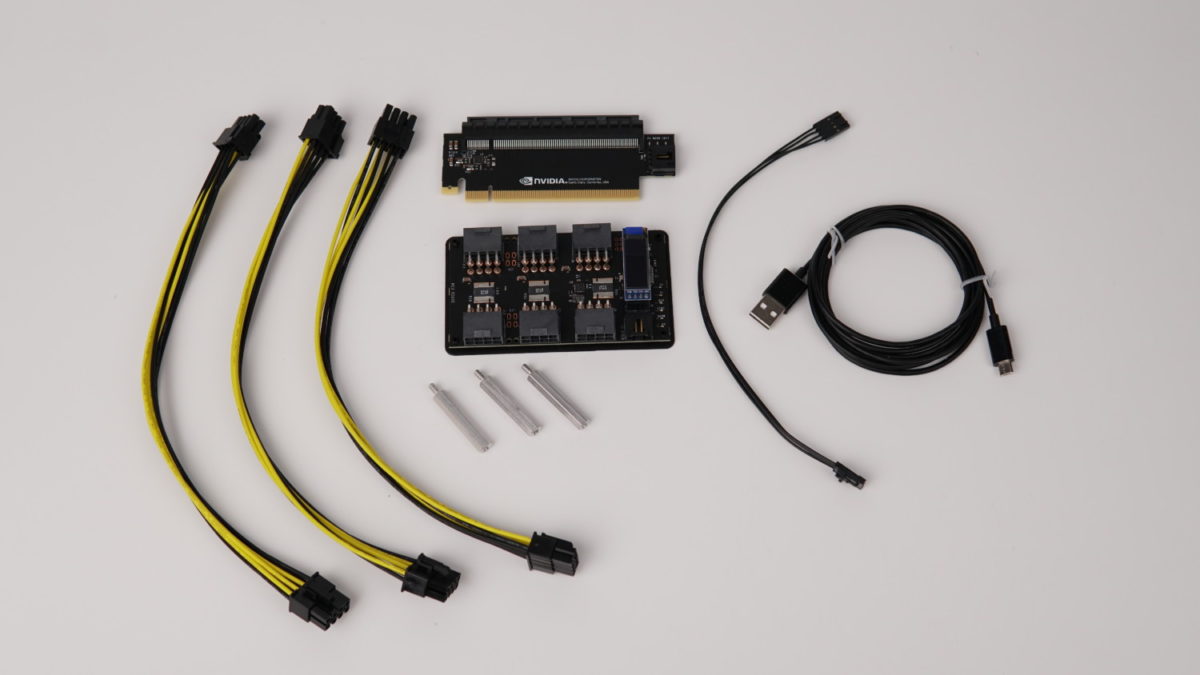
Going back to PCAT, it arrives in a simple kit as below:
It comes with the PCAT mainboard, three PCIe 8/6-pin cables, a USB cable, a PCIe riser card, a connector cable for the riser card and mainboard and a couple of extended standoffs.
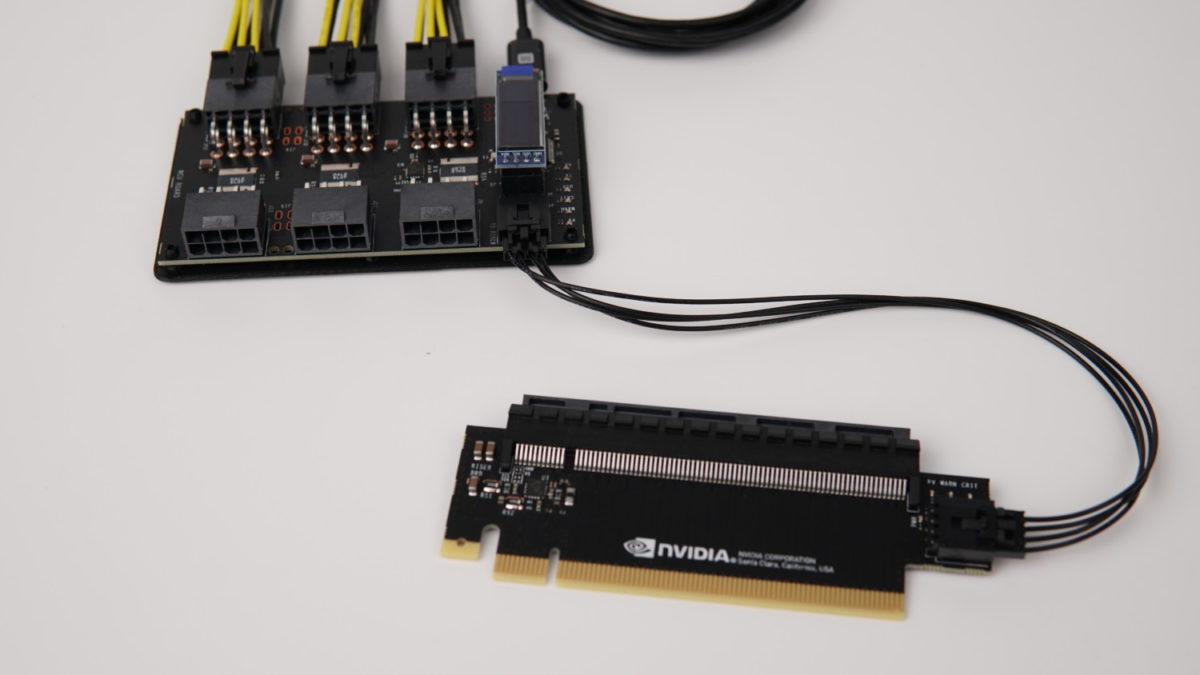
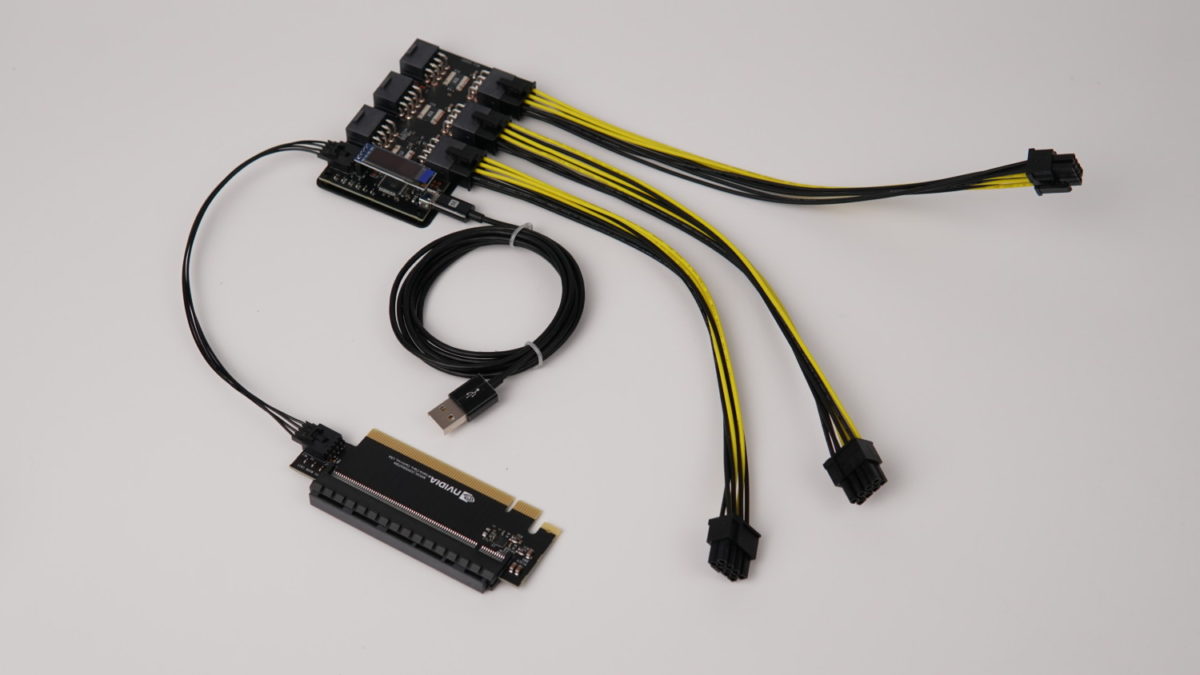
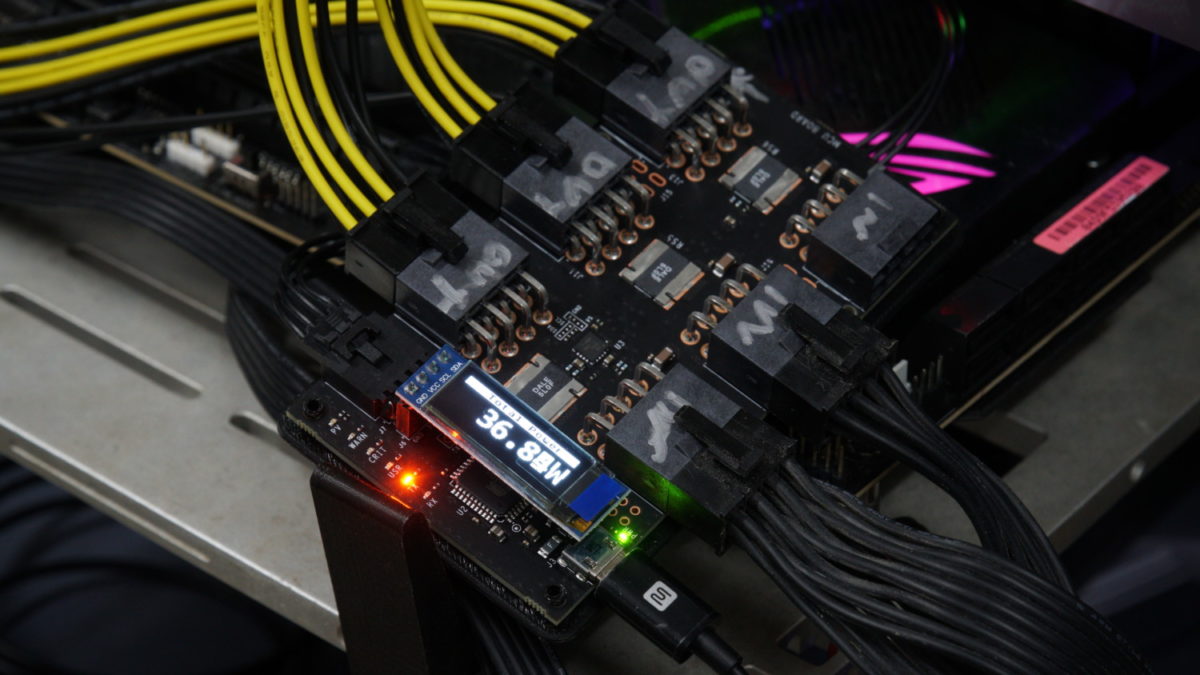
The kit is easily assembled into the image above where a row of input cables connects to your PCIe power cables and the PCIe riser sits between the GPU and motherboard. 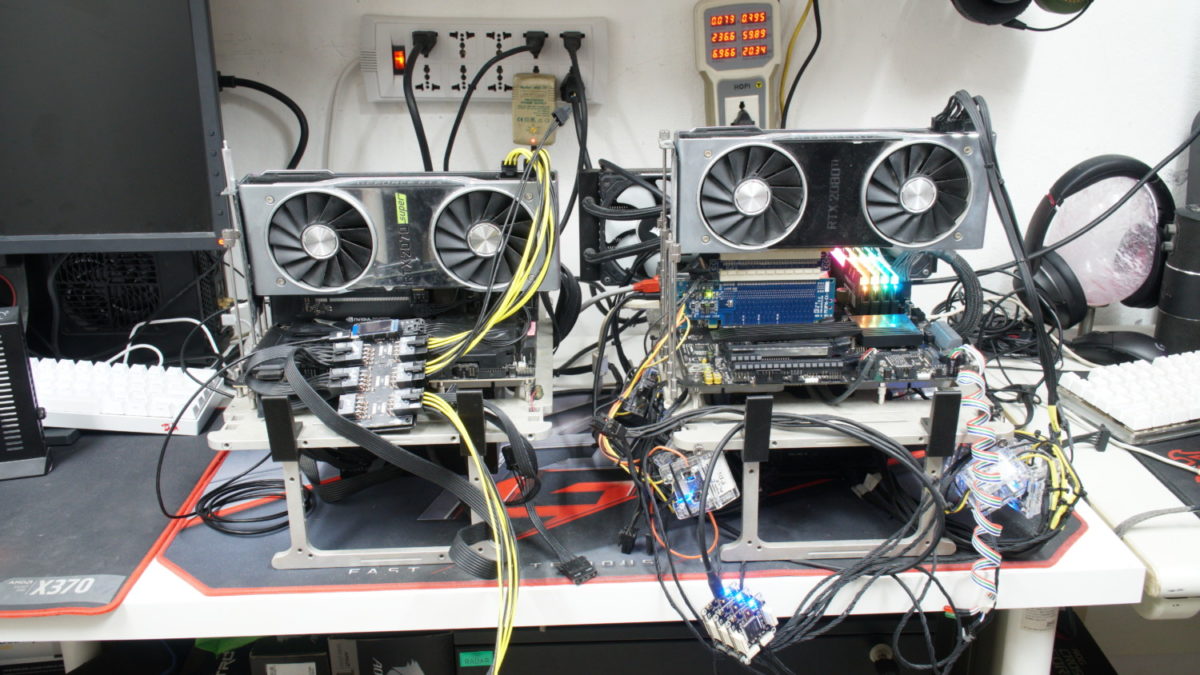
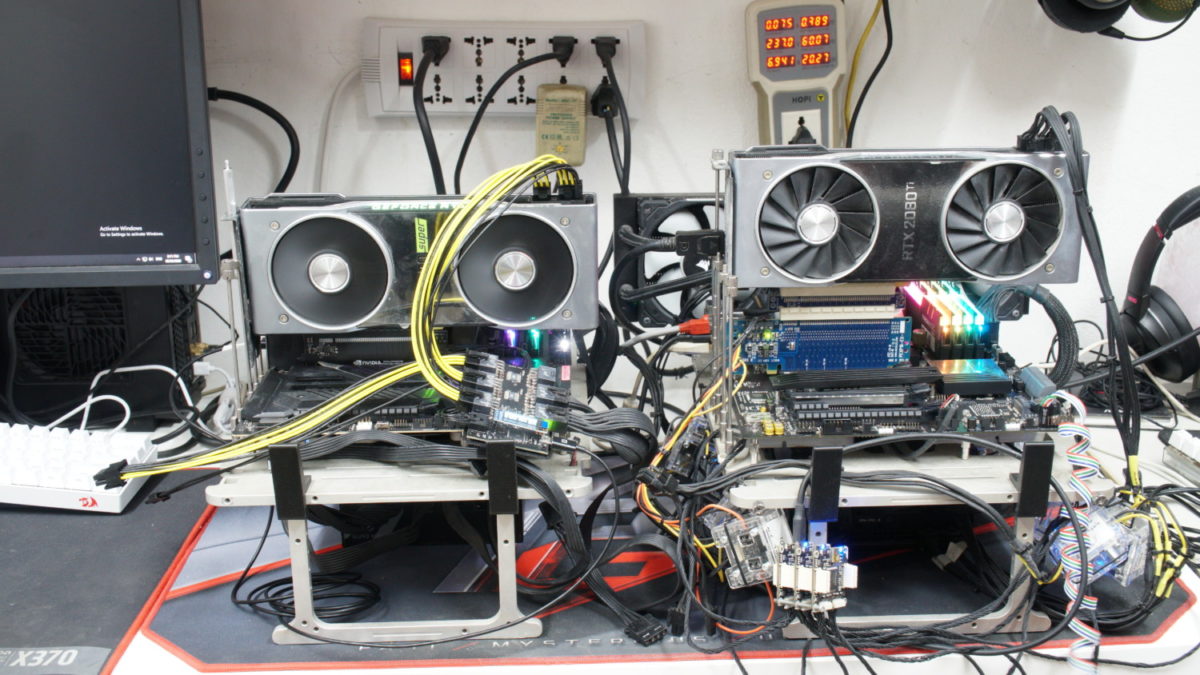
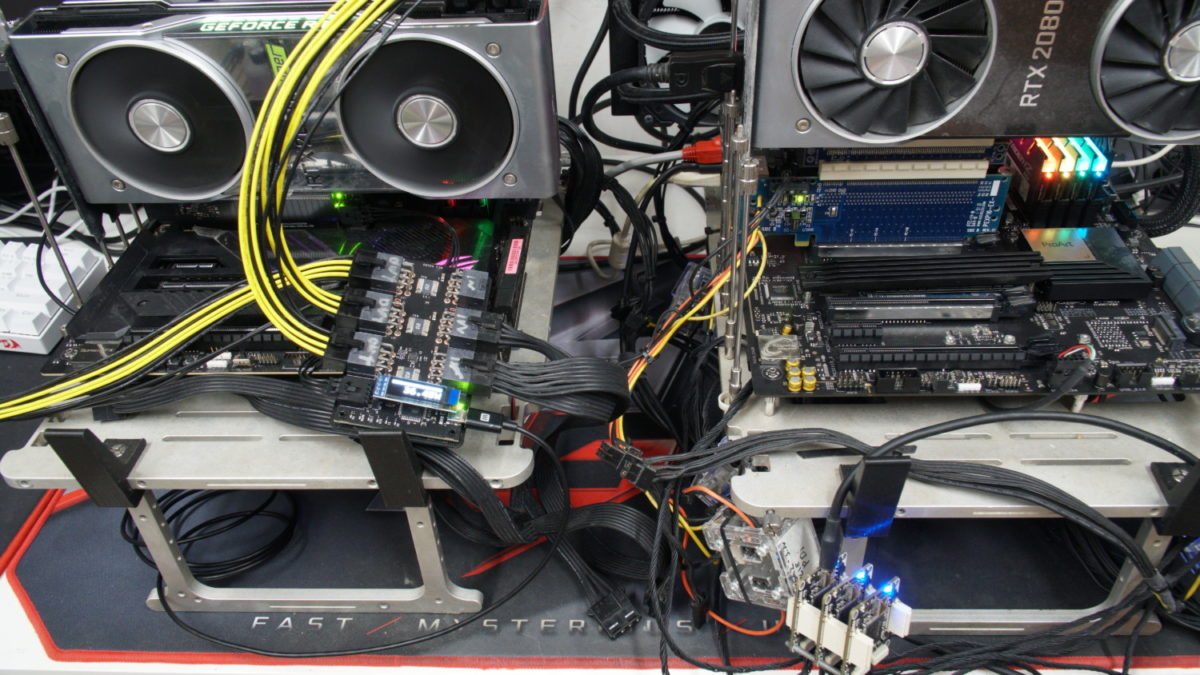
And here PCAT side-by-side with Powenetics. My setup is messy already but you can see which cleans up better between the two. I’ll get down to head-to-head comparison later on this article but for now, PCAT is looking pretty clean and if GPU-only reading is needed, this is pretty much everything you have to setup. I’d like to note that PCAT doesn’t work with the screws for OpenBenchTable.
The back of the PCAT mainboard is covered with a 3D-printed layer for cover to prevent the solder points from making contact when laid flat. Make sure though that the PCIe power connectors’ exposed pins don’t make contact withe conductive objectives or you may risk a short or even worse.
The mainboard can connect to a secondary system or the tested system itself. As the load is quite low, it does not matter where you use it for making readouts.
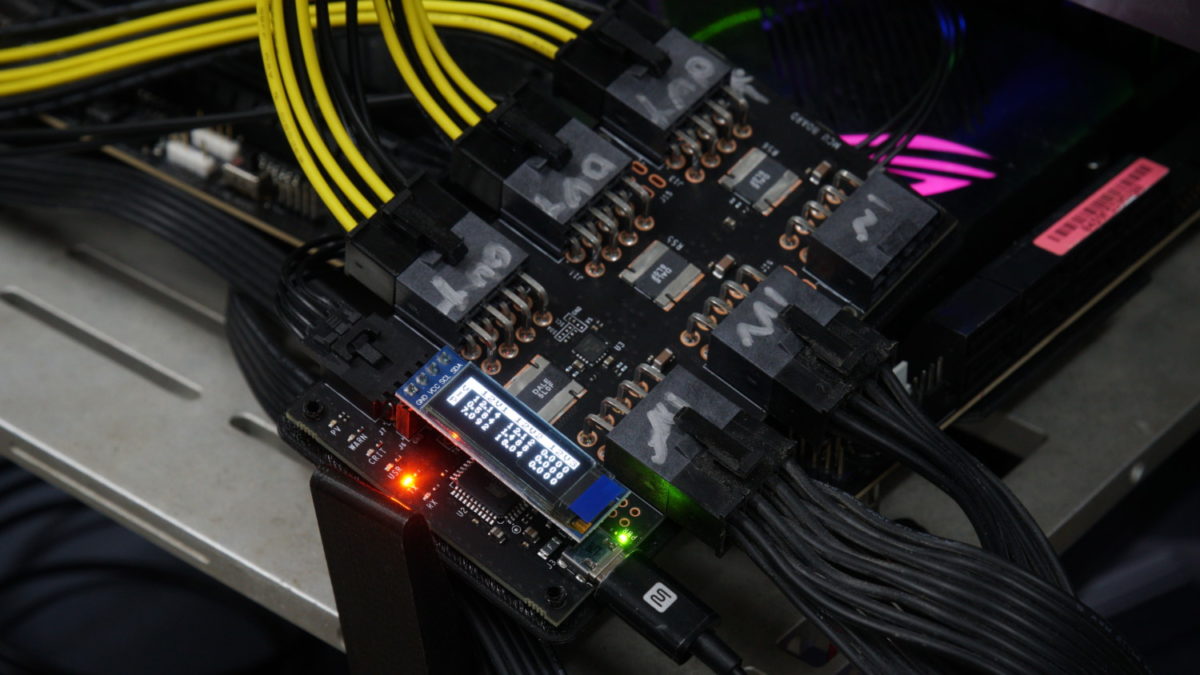
There is also an LCD screen onboard. It doesn’t have any control but cycles through total power draw and the individualized list.
PCAT Software
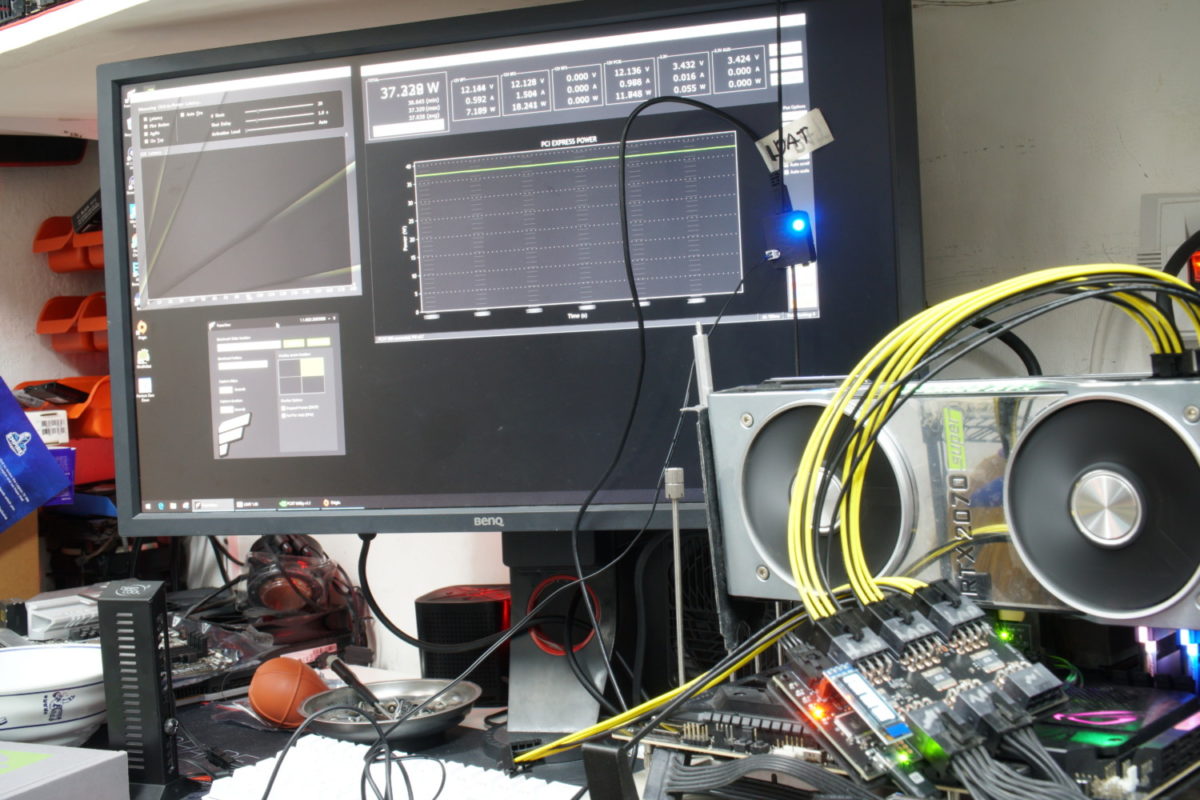
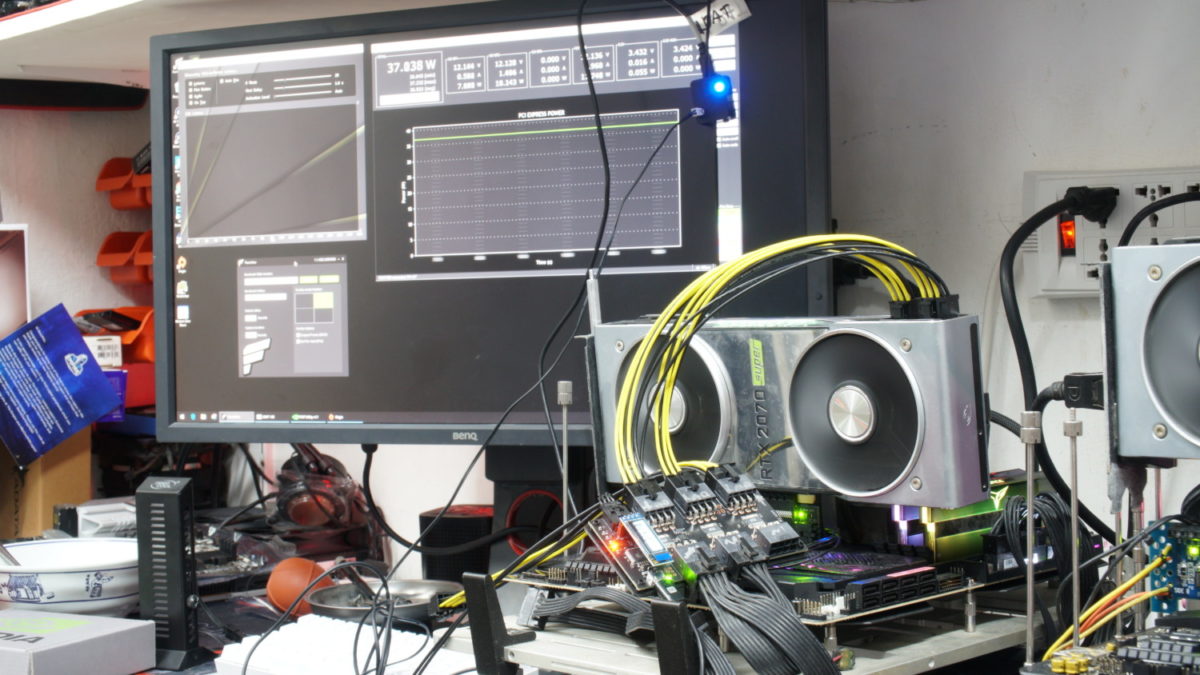
PCAT’s software is actually only comprised of a single screen. In the image above you can see a setup with the PCAT board connected to the test system.
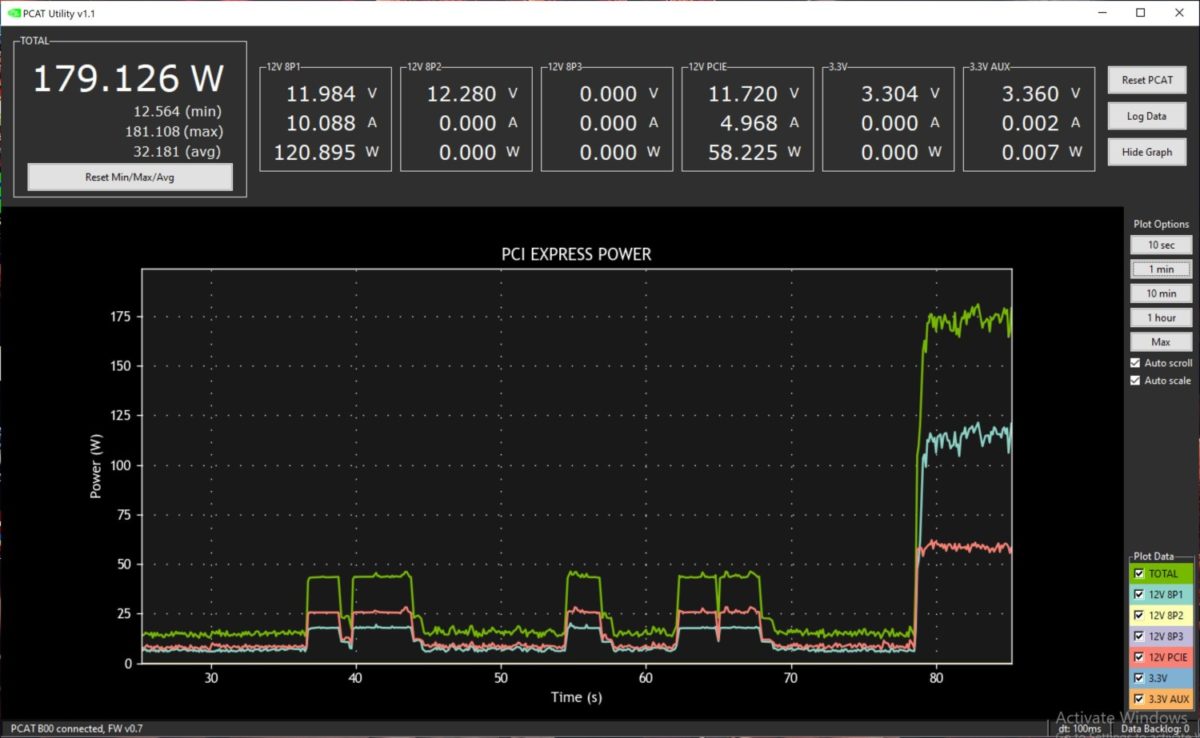
Here’s a shot of the PCAT software. The interface is just a single screen which has graphs for the current total power as well as per rail consumption which you can toggle in-between. Moving over to the upper part of the screen we have the summary total of power draw along with the min/max/avg power draw. Alongside that is a row of readings for each rail with its own breakdown of the voltage, current and wattage of each line. This is useful when trying to identify a specific draw like in the case of the RX 480 reported sipping more than 75W from the PCIe slot, we can read that here. Other than that we have controls like resetting the data, resetting the PCAT board itself, hiding the graphs etc. The important part here is data logging.
PCAT keeps a CSV log for you but since there is not hotkey we’ll have to align data manually. That said, let’s move on data usage.

The chart above shows the power draw of an RTX 2080 Ti logged during a Final Fantasy XV Benchmark run in 4K High Detail. We captured this a few seconds before the benchmark and kept it idle after so you can see the difference between idle and load power over time. This is a great tool for performing and making profile readings of specific loads. Other than that, we can take the log and create various visualizations of the chart data like a simple bar chart for Min/Max/Avg readings.
Power draw varies by application. Your GPU’s power draw when watching a video, playing a game and doing absolutely nothing will be different from another. This also varies between systems and graphics card. An RTX 2080 will draw less power than an RTX 2080 Ti. When presenting power data, its important to identify power draw to a specific applications. Due to the limitation of my system draw reading as well as API reading, it’s not possible to get a concrete reading of how much power your GPU is using on specific use cases. That said, PCAT has full integration with the new FrameView v1.1 from NVIDIA and we have an article covering the updates on that so check out here.
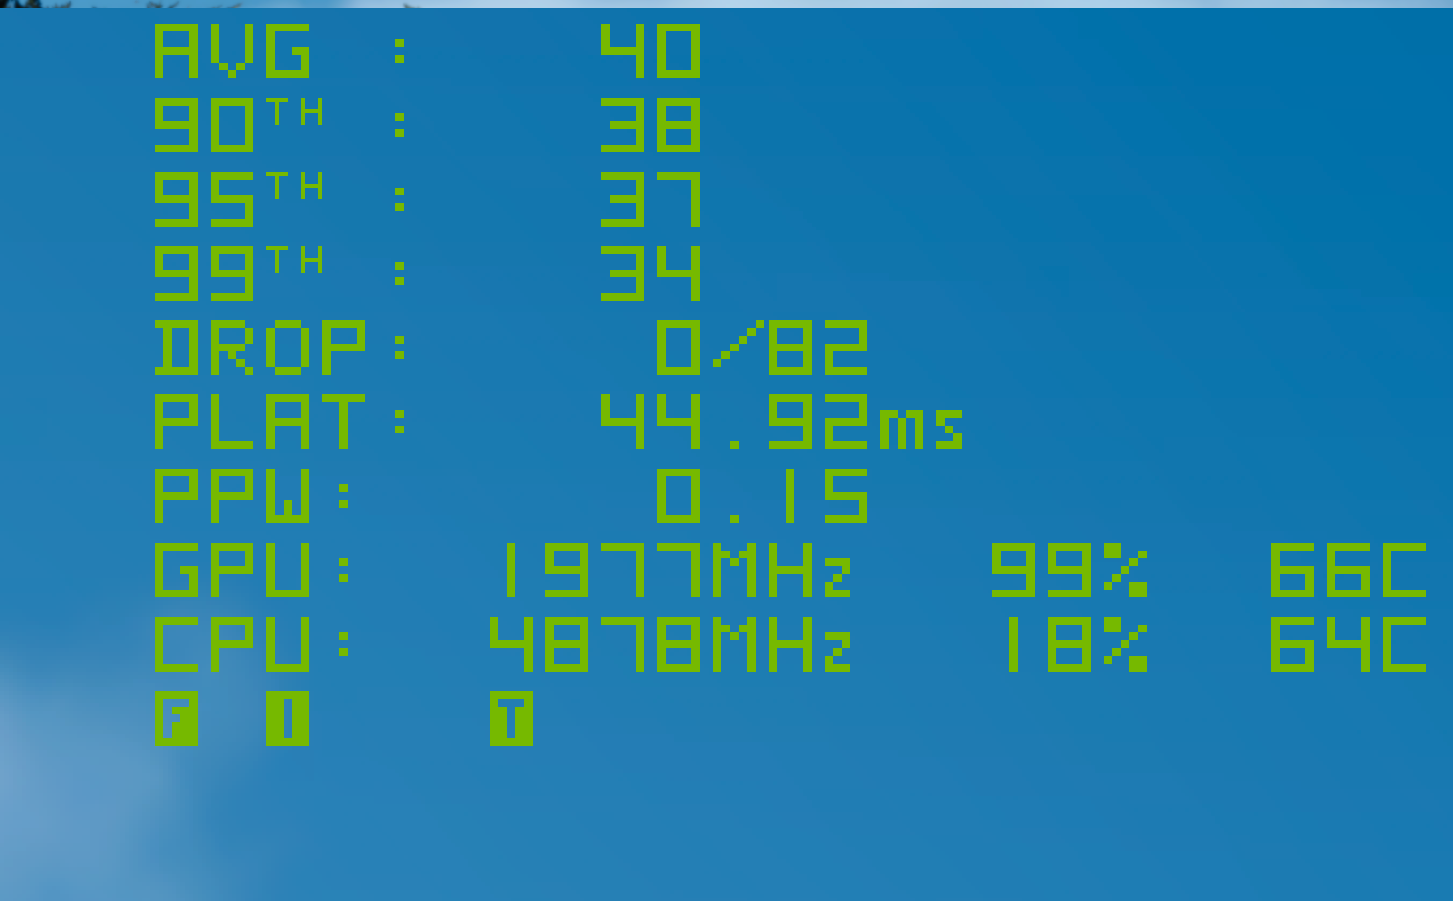
In FrameView v1.1 we have access to PPW or performance-per-watt and when using the FrameView v1.1 Analyzer, we have the option of using PCAT to see the PPW specific to that benchmark:

With PCAT selected, we have access to this chart in the FrameView v1.1 Analyzer template:

This chart shows us the variance that may be shown from the API versus PCAT as the chart above shows. Here we have the same benchmark from above but notice how its reflecting a much more steady reading thru the API versus the PCAT reading. We also get some outliers during the beginning of the benchmark which occurred twice on PCAT but not as significant as it is on the API reading. This is important to note because if the outliers are reproducible, it may help in analyzing the cause but with an API reading, it may go completely ignored.

As mentioned earlier, Performance-Per-Watt is one of the greatest and potentially the most important metric possible with this tool and with the help of FrameView v1.1 helps us make a visual of how much our GPUs work and how much work they actually put in compared to the out.
PCAT vs Powenetics
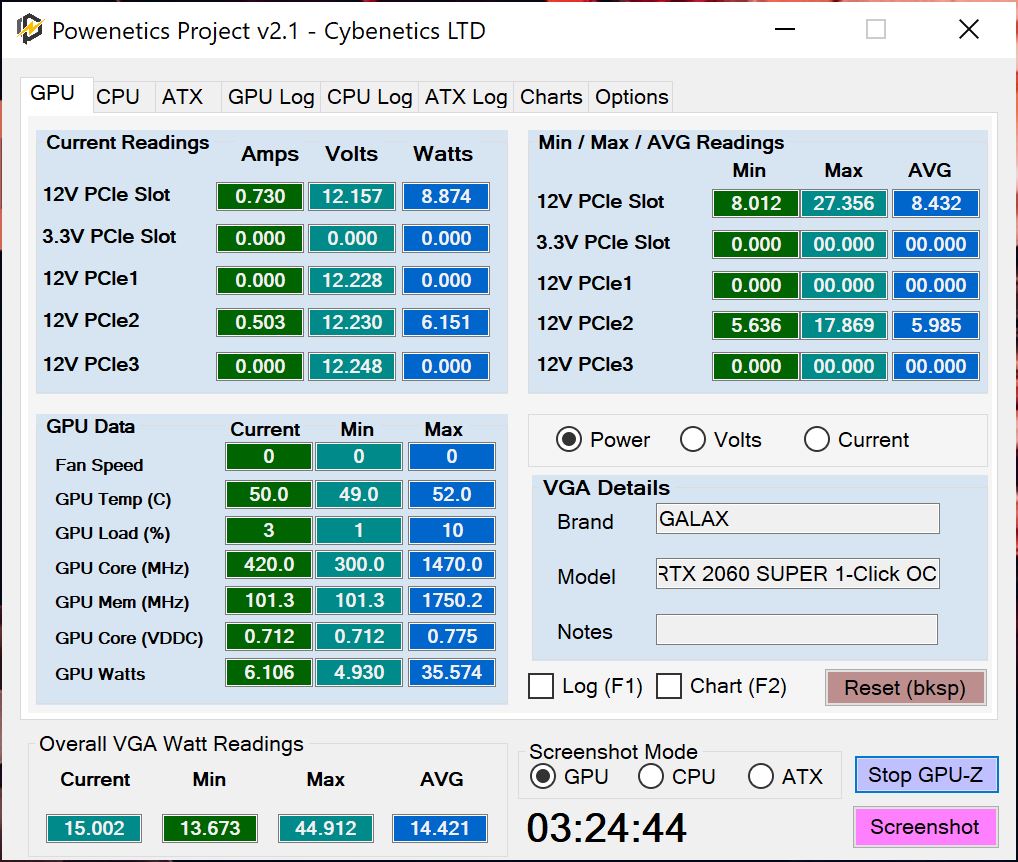
In terms of usability, both power measurement solution are functional. Powenetics offers extensive power reading both CPU usage as well as ATX (SATA/MOLEX) power making it a much better solution for taking readings of multiple components. PCAT on the other hand is a GPU power draw measurement solution which means it only does one thing, and it does that good as well.
Comparing both from a GPU power measurement perspective, PCAT automatically wins by default for the simple fact that it has integration with FrameView v1.1 which allows reviewers to plot data much easier. Powenetics has a manual logging tool and any manipulation of data or aligning has to be done from the ground up. Any kind of automation has to be bespoke as well. When making this article, I noticed that by default, PCAT and Powenetics do not gather data at the same rate so resulting data is logged in different timings. This makes it difficult aligning data for direct comparison. Powenetics’ advantage here is that you can configure it through the options. PCAT does not have this option. Although again, it is timed along with FrameView making it functionally more useful when making line charts.
Installation also favors PCAT. The ready-made board and 3D-printed board cover makes it easy to place anywhere on a bench or case. Powenetics’ bricklets requires explicit placement. And is primarily limited to only an open test bench scenario. Ultimately, PCAT wins here for sheer ease of use and installation.
Last up is the software. PCAT is plain and straight forward. Powenetics comprehensive and also straightforward with this information but is also peppered with some other functionalities. Features like charting are simplistic vs. the entire functionality of the set.
Still, both products have their strength of the other and while it is quite obvious the GPU readout functionality of PCAT and to match that FPS information makes it an extensively useful tool, Powenetics CPU and ATX measurement readout and tools make it the far more extensive tool in terms of testing versatility and application.
Standardized Power Measurements
As more and more solutions for power measurement becomes available, access to such hardware will be much more prevalent and therefore should provide reviewers and ultimately end-users the tools they need for a more comprehensive benchmarking ecosystem. The endgame here is that with information such as power draw becoming more visible for user to gauge, efficiency will now become an important factor and there will be no more excuse to justify higher power draw for brute raw power.
I hope you are all as excited as I am for gaming technology in the coming months. Its definitely going to be a big year for gaming and even a bigger year afterwards.


